. 2022 Apr 27;11:e73614. doi: 10.7554/eLife.73614

Figure 6. TGF-β1-mediated mechanical stimulation to enhance enthesis injury repair.

(a) Schematic diagram of ELISA analysis. (b) ELISA analysis of TGF-β1 concentration during the enthesis healing procedure. n = 3 per group. (c) Representative image of H&E and Toluidine blue/Fast green staining of enthesis. Scale bar, 200 μm. (d) Quantitative analysis of H&E score and fibrocartilage thickness. The red dolt line indicated the perfect histological score of 28. n = 6 per group. (e) Quantitative analysis of Failure Load and stiffness. n = 9 per group. (f) Representative immunofluorescent images of Tdtomato (red) staining of Prrx1+ cells and DAPI (blue) staining of nuclei under different mechanical stimuli at postoperative 2 weeks. Scale bar, 200 μm. (g) Quantitative analysis of migration Prrx1+ cells at the healing area. n = 6 per group. Data were presented as mean ± SD. *p < 0.05, **p < 0.01, ***p < 0.001.

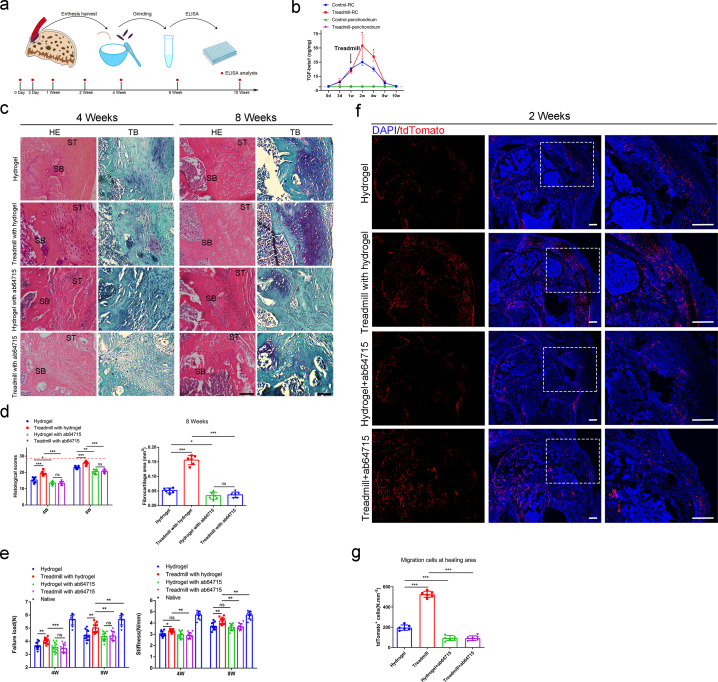
Figure 6—source data 1. The source data of TGF-β1 concentration during the enthesis healing procedure for Figure 6b.
The source data of quantitative analysis of H&E score and fibrocartilage thickness for Figure 6d. The source data of quantitative analysis of Failure Load and stiffness for Figure 6e. The source data of quantitative analysis of migration Prrx1+ cells at the healing area for Figure 6g.

Figure 6.

Figure 6—figure supplement 1. Mechanical stimulation could amplify the transmission of TGF-β signaling.

Figure 6—figure supplement 1.

(a) Schematic image and gross view of the cell loading system. (b) Scratch assay and transwell assay of Prrx1 + cells. Scale bar, 100 μm. (c) Quantitative analysis of migration cells in a scratch assay. n = 5 per group. (d) Quantitative analysis of migration cells in transwell assay. n = 5 per group. (e) Western blot analysis of Smad2/3, phosphorylation of Smad2/3. (f) Quantitative analysis of western blot. n = 5 per group. Data were presented as mean ± SD. *p < 0.05, **p < 0.01, ***p < 0.001.
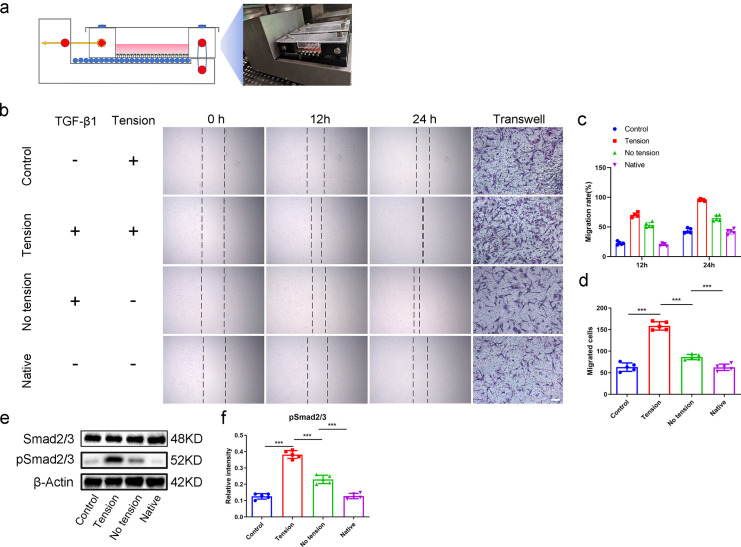
Figure 6—figure supplement 1—source data 1. The source data of quantitative analysis of migration cells in a scratch assay for Figure 6—figure supplement 1c.
The source data of quantitative analysis of migration cells in transwell assay for Figure 6—figure supplement 1d. The source data of quantitative analysis of western blot for Figure 6—figure supplement 1f.
Figure 6—figure supplement 1—source data 2. The the original files of the full raw unedited gels.