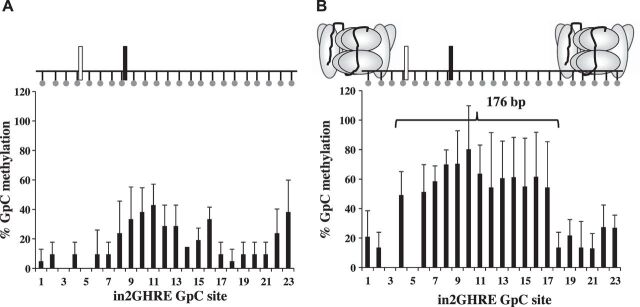
Fig. 4.
Nucleosome position analysis by NoMe-seq across the IGF-1 in2GHRE from nuclei extracted from day (d)14 (A) and d21 mouse livers (B). At d21, a 176 bp region is fully accessible correlating with a single displaced nucleosome. Each GpC site is represented by a ball and stick. Results for GpC sites 3 and 5 were in the context of GCG and therefore excluded due to interpretation inability. Relative locations of the 2 STAT5b binding sites are represented by white and black rectangles.

