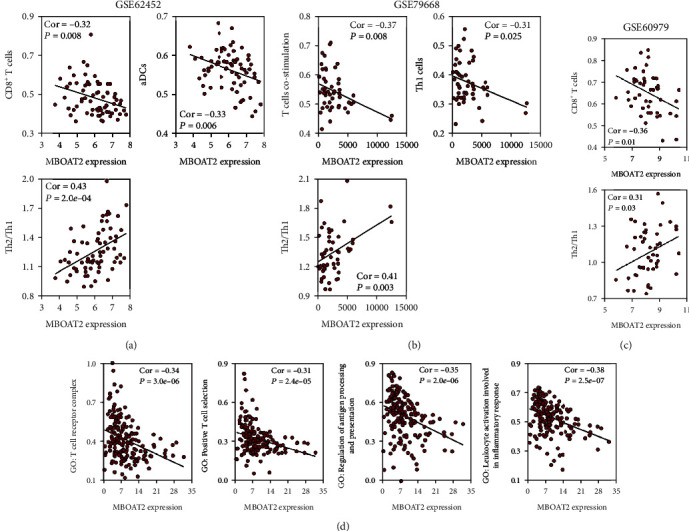
Figure 10.

(a) A correlation analysis between the MBOAT2 level and immune-related terms from the ssGSEA analysis of the GSE62452 cohort (|Cor| > 0.30, P < 0.05). (b) A correlation analysis between the MBOAT2 level and immune-related terms from the ssGSEA analysis of the GSE79668 cohort (|Cor| > 0.30, P < 0.05). (c) A correlation analysis between the MBOAT2 level and immune-related terms from the ssGSEA analysis of the GSE60979 cohort (|Cor| > 0.30, P < 0.05). (d) A correlation analysis between the MBOAT2 level and immune-related biological functions from GSEA of the TCGA PC cohort. Spearman's correlation was performed in (a)–(d).
