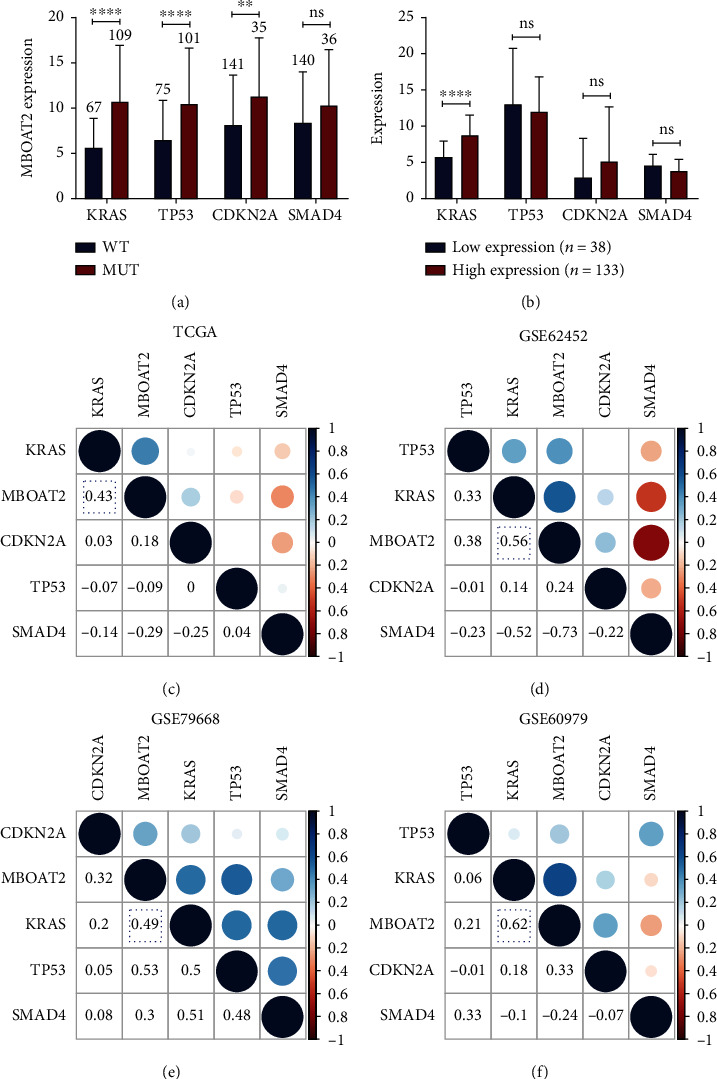
Figure 5.

(a) KRAS, TP53, and CDKN2A mutation statuses are dramatically related to a higher expression level of MBOAT2. (b) KRAS level was notably upregulated in the MBOAT2 high-expression group (P < 0.0001). (c–f) Linear relation analyses indicated that the MBOAT2 expression level is positively related to that of KRAS. P values were determined by nonparametric Mann-Whitney U-test in (a) and (b) (∗P < 0.05; ∗∗P < 0.01; ∗∗∗P < 0.001; ∗∗∗∗P < 0.0001).
