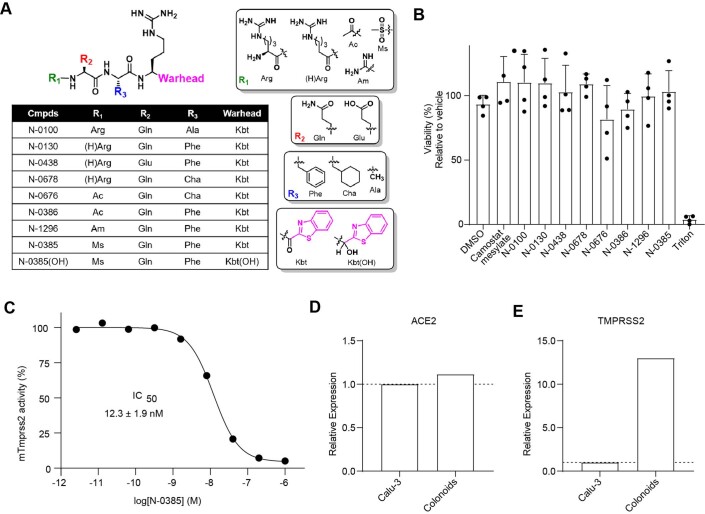
Extended Data Fig. 1. Characterization of peptidomimetic inhibitors.
(A) Backbone structure of peptidomimetic compounds used in this study along with the groups used in the N-terminal R1 position, R2, R3 and the C-terminal warhead (ketobenzothiazole; kbt) and alcohol warhead (Kbt(OH)). The P1 position is Arginine in all compounds. (B) Cytotoxicity of compounds in Vero E6 cells. Cellular viability was evaluated after 24 h exposure to 10 μM of the indicated compounds (n = 4 independent experiments performed in duplicate). Results are background corrected and presented as the mean viability (%) ± standard deviation (SD) compared to one replicate of vehicle treated cells (DMSO 0.01%) in each experiment. Triton X-100 0.01% was used as a toxicity control. (C) N-0385 inhibition of mouse TMPRSS2 (mTMPRSS2). Vero E6 cells were transfected with either an empty vector or mTMPRSS2 for 24 h. N-0385 was added concomitantly with a fluorogenic substrate on cells for an additional 24 h before fluorescence reading. Relative activity was measured using the mock-subtracted fluorescence and reported as the percentage of residual activity. Dose–response curves were generated and IC50 values were determined using nonlinear regression analysis. One representative IC50 curve is shown. The IC50 value shown represents the mean ± SD from n = 3 independent experiments. (D, E) Real-time PCR analysis for relative expression of (D) ACE2 and (E) TMPRSS2 expression in Calu-3 cells and colonoids. Relative expression levels normalized using 3 housekeeping genes (YWHAZ, PUM1, MRPL19) are shown for one sample (RNA extract) performed in technical triplicates

