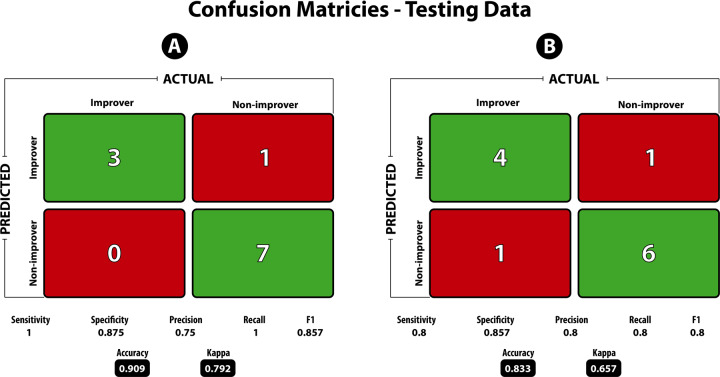
Fig. 1. Confusion matrix statistics on the testing dataset for the model predicting 3-month and 12-month improvers and non-improvers.
Sensitivity and recall are defined as the true positive rate (i.e., number of predicted improvers divided by the total number of improvers), Specificity is defined as the true negative rate (i.e., number of predicted non-improvers divided by the total number of non-improvers). Precision is the ability of the classifier to not label a true negative as a positive (i.e., the ability to not label a non-improver an improver). The F1 score is the harmonic mean of precision and recall, with values closer to 1 being a better score. Accuracy is defined as the number of true positives and true negatives divided by the total population. The Kappa statistic is known to be a better measure compared to accuracy, especially in the case of imbalanced classes. Kappa values between 0.61 and 0.80 are said to be “Substantial” and between 0.81 and 1.0 to be “Almost Perfect”.

