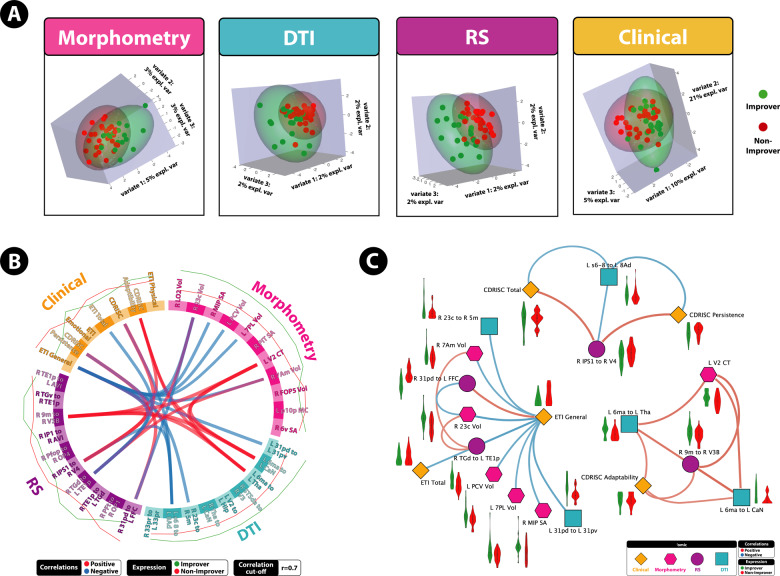
Fig. 3. A highly correlated multi-modal, brain-clinical signature predicts 3 month IBS symptom trajectories via DIABLO.
A Sample plots for morphometry, anatomical connectivity, resting-state functional connectivity, and clinical variables for the 3 month DIABLO analysis. Samples are represented as points according to their projection across three latent variables. B Circos plot for the 3 month DIABLO analysis representing all of the features in the DIABLO model, and the correlations between variables of different data types. Correlation cut-off is set to r = 0.7. Lines along the outside of the circle represent the mean “expression” levels. Greater levels are in accordance to the line being farther away from the circle. C Relevance network for the 3 month DIABLO analysis representing the correlation between variables of different data types. Red lines represent positive correlations and blue lines represent negative correlations. Boxplots with violin plots represent the distribution of each group for each feature. Correlation cut-off is set to r = 0.7.

