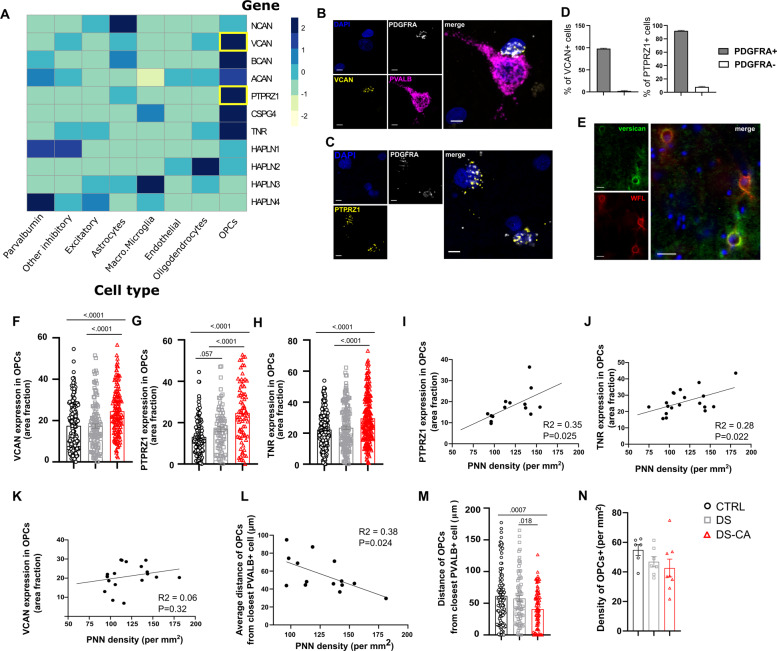
Fig. 2. Gene expression of canonical PNN components is enriched in OPCs and upregulated in depressed suicides with a history of child abuse.
A Expression of canonical components of PNNs according to cell type, derived from single-nucleus RNA sequencing of 34 human dlPFC (BA9) samples [20]. OPCs consistently express higher levels of most of these components compared to other cell types. B Representative images of FISH validation of VCAN (Versican, yellow) expression in OPCs (PDGFRA+ cells, white). Note the VCAN-expressing OPC juxtaposed to a PVALB+ (magenta) cell. Nuclei were counterstained with DAPI (blue). Scale bar = 5 µm. C Representative images of FISH validation of PTPRZ1 (Phosphacan, yellow) expression in OPCs (PDGFRA+ cells, white). Nuclei were counterstained with DAPI (blue). Scale bar = 5 µm. D Both VCAN (left) and PTPRZ1 (right) expression is highly enriched in OPCs, with 97.8% of VCAN+ cells (N = 225) co-expressing PDGFRA and 91.8% of PTPRZ1+ cells (N = 281) co-expressing PDGFRA. E Representative image of versican (green) immunolabeling. Despite enrichment of VCAN gene in OPCs, the versican protein shows a characteristic PNN staining pattern and colocalized with WFL (red). Nuclei were counterstained with DAPI (blue). Scale bar = 25 µm. F The average expression of VCAN in OPCs was significantly higher in DS-CA subjects (N = 139 cells, 7 subjects) compared to CTRLs (N = 160 cells, 8 subjects) and DS (N = 119 cells, 6 subjects) (one-way ANOVA F(2, 415) = 17.25, P < 0.0001, followed by Tukey’s multiple comparison test). G The average expression of PTPRZ1 in OPCs was significantly higher in DS-CA subjects (N = 63 cells, 4 subjects) compared to CTRLs (N = 117 cells, 6 subjects) and DS (N = 81 cells, 5 subjects) (one-way ANOVA F(2, 258) = 31.65, P < 0.0001, followed by Tukey’s multiple comparison test). H The average expression of TNR in OPCs was significantly higher in DS-CA subjects (N = 200 cells, 8 subjects) compared to CTRLs (N = 207 cells, 7 subjects) and DS (N = 160 cells, 5 subjects) (one-way ANOVA, F(2, 564) = 18.69, P < 0.0001, followed by Tukey’s multiple comparison test). Both PTPRZ1 (I) and TNR (J), but not VCAN (K) average expression in OPCs modestly correlated with PNNs densities (R2 = 0.35, P = 0.025 and R2 = 0.28, P = 0.022, respectively). L A negative correlation was found between average distance of OPCs from closest PVALB+ cell and PNNs density (R2 = 0.36, P = 0.024), suggesting that OPCs proximity with PVALB+ cells could be associated with changes in PNN density. M Proximity of OPCs with PVALB+ cells was increased in DS-CA subjects (N = 90 OPCs, 5 subjects) compared to CTRLs (N = 106 OPCs, 6 subjects) and DS (N = 73 OPCs, 4 subjects) (one-way ANOVA: F(2, 266) = 7.963, P = 0.0004, followed by Tukey’s multiple comparison test). N Average densities of PDGFRA+ OPCs were not changed between DS-CA (N = 8), DS (N = 7), and CTRL (N = 6) groups (Kruskal–Wallis ANOVA, H(2,21) = 4.67, P = 0.095).

