
Fig. 4. Crystal structure and characterization of TkArkI.
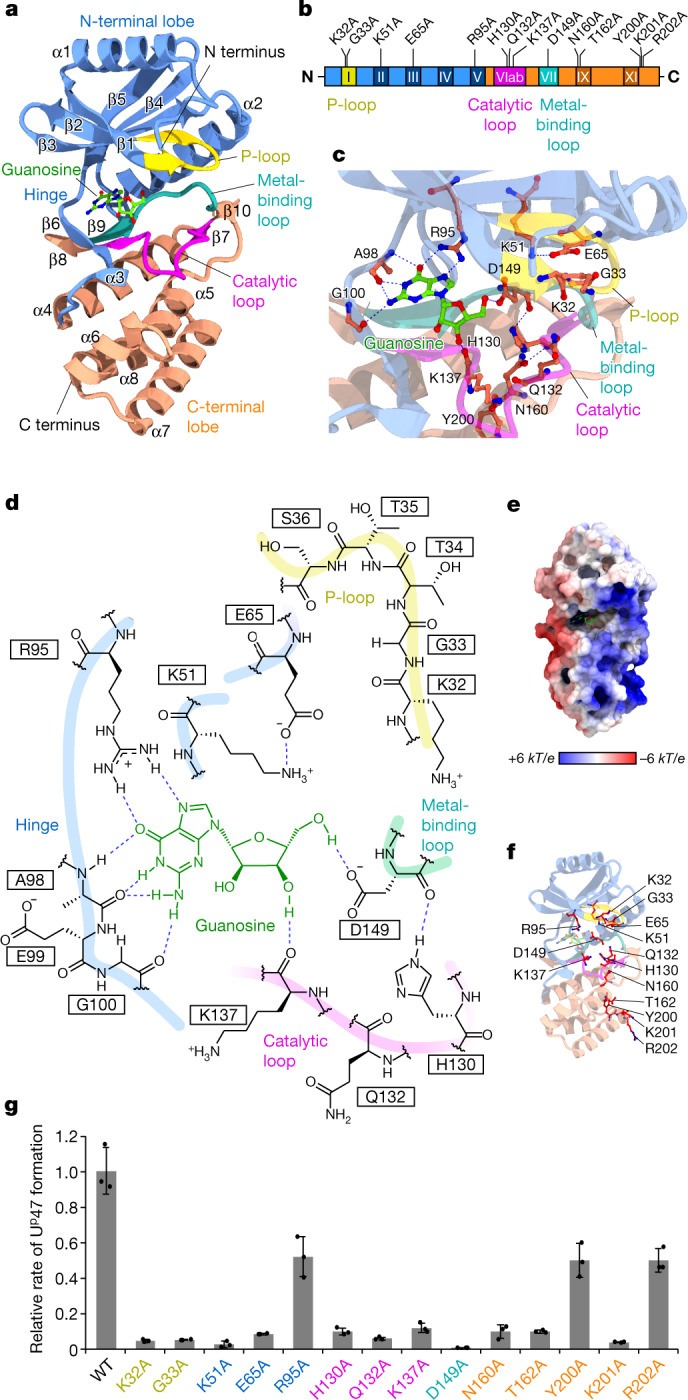
a, Overall structure of TkArkI with five features highlighted: the N-terminal lobe (residues 1–30 and 39–109; blue), P-loop (residues 31–38; yellow), C-terminal lobe (residues 110–127, 141–144 and 154–216; orange), subdomain VIb (catalytic loop, residues 128–140; pink) and subdomain VII (metal-binding loop, residues 145–153; cyan). Guanosine observed in a putative ATP-binding pocket is shown in ball-and-stick representation. b, Subdomains of TkArkI showing the locations of mutations examined in this study. Colour codes for each feature are the same as in a. c, Close-up view of the putative ATP-binding pocket in TkArkI. Residues for which mutations were examined in this study are indicated. Guanosine is shown in ball-and-stick representation. d, Schematic diagram of guanosine binding in the putative ATP-binding pocket. Predicted interactions are indicated with dashed lines. The main chains of the P-loop, hinge, catalytic loop and metal-binding loop are shown with bold lines. e, Electrostatic surface potential of TkArkI. Positively and negatively charged areas are coloured in blue and red, respectively. Guanosine is shown in ball-and-stick representation. The surface potential is described as dimensionless numbers. kT/e refers to the conversion factor (k, proportion constant; T, temperature; e; charge unit). f, Positions of mutation sites indicated in the crystal structure. g, Relative activities of a series of TkArkI mutants, normalized against the activity of wild-type TkArkI. Data represent the average values of technical triplicates ± s.d.