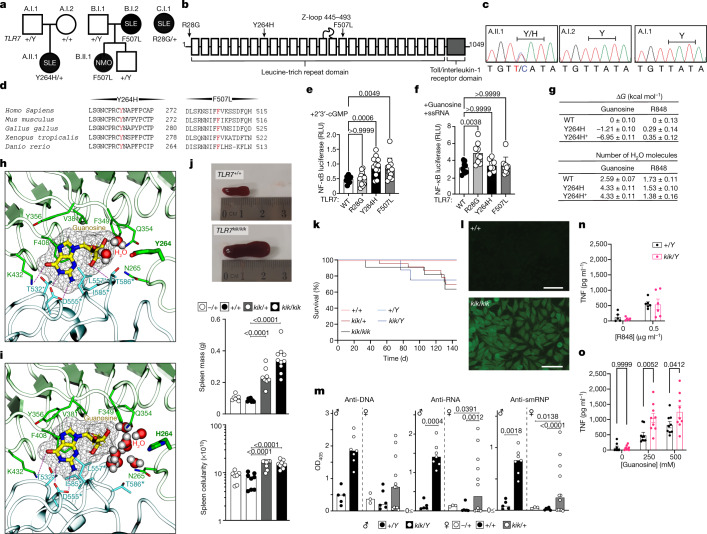
Fig. 1. TLR7 variants in patients and mice with systemic autoimmunity and ligand-binding modelling.
a, b, TLR7 variants in families (a) and within protein domains25 (b). c, Sanger sequencing results. d, Conservation. e, f, NF-κB activity (ratio of NF-κB firefly to Renilla luciferase relative light units (RLU)) after human TLR7 plasmid transfection into RAW264.7 cells treated with 2′,3′-cGMP (e) or guanosine plus ssRNA (f). Data are mean and s.d. n = 12 biological replicates or transfections shown as individual dots. Statistical significance was calculated using one-way analysis of variance (ANOVA) with Bonferroni correction for multiple comparisons, compared with wild-type TLR7. g, Binding free energy (ΔG; top) of guanosine and R848 relative to wild-type (WT) TLR7 for the Y264H and Y264H+ mutants, and the number (bottom) of bound water molecules within 3.5 Å of ligand tail hydrogen and oxygen atoms. Data are mean and s.e.m. h, i, Molecular dynamics simulations showing the binding pose of guanosine to wild-type (h) and Y264H (i) TLR7. Guanosine is shown in thick liquorice with yellow carbon atoms and mesh surface. TLR7 is shown as a ribbon representation with the guanosine-interacting residues shown as sticks. Individual protomers are coloured green and blue. The dashed lines indicate hydrogen bonds. Asterisks indicate residues belonging to the other protomer. Water molecules within 5 Å of both guanosine and residue 264 are shown. j, Spleens from Tlr7+/+ and Tlr7kik/kik female mice (top). Bottom, median spleen mass and cellularity. k, The survival of kika mice. n = 12 (Tlr7+/+), n = 25 (Tlr7+/kik), n = 11 (Tlr7kik/kik), n = 11 (Tlr7+/Y), n = 7 (Tlr7kik/Y). l, Hep-2 immunofluorescence showing ANAs in 12-week-old kika mice. Representative of n > 10 mice. Scale bars, 100 µm. m, Serum antibodies to ssDNA (ANA), ssRNA and smRNP from kika mice (aged 12 weeks). OD405, optical density at 405 nm. Bars indicate median values. n, o, TNF production from mouse BMDMs treated with R848 (n) or guanosine (o). Data are mean ± s.e.m. The results represent n = 4 (j), n = 3 (e, k, m–o) or n = 2 (f) experiments. Statistical analysis was performed using Tukey multiple-comparison tests (j, m); and two-way ANOVA with Sidak (o). Exact P values are shown.

