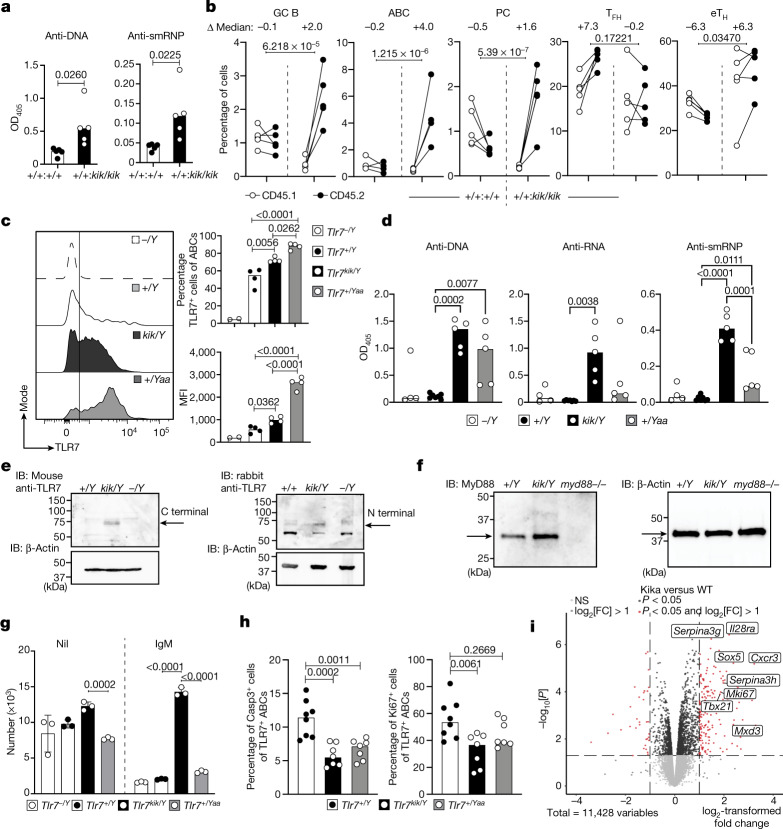
Fig. 3. Cell-intrinsic expansion of ABCs and GC B cells in kika mice, aberrant B cell survival and extrafollicular autoimmunity induced by the Y264H variant.
a, b, Autoantibodies to DNA and smRNP in the serum (a) and cellular splenic phenotypes (b) from mixed bone marrow chimeric mice containing a 1:1 ratio of control Tlr7+/+CD45.1/Tlr7+/+ CD45.2 or Tlr7+/+CD45.1/Tlr7kik/kikCD45.2 bone marrow. c, Histogram plot and quantification of TLR7 expression in ABCs from Tlr7−/Y (n = 2), Tlr7+/Y (n = 4), Tlr7kik/Y (n = 4) and Tlr7+/Yaa (n = 4) mice. d, Autoantibodies to DNA, RNA and smRNP in the serum from Tlr7−/Y (n = 4), Tlr7+/Y(n = 7), Tlr7kik/Y(n = 5) and Tlr7+/Yaa (n = 5) mice. e, f, Western blot analysis showing splenocyte expression of TLR7 (e) and MyD88 (f) from mice of the indicated genotypes. IB, immunoblot. g, Survival of magnetic-activated cell sorting (MACS)-purified splenic B cells cultured with or without anti-IgM for 72 h from male mice of the indicated genotypes. Data are mean ± s.d. h, Quantification of apoptosis (caspase-3) and proliferation (Ki67) in ABCs from male mice (Tlr7+/Y n = 8, Tlr7kik/Y n = 7, Tlr7+/Yaa n = 7). i, Differentially expressed genes in MACS-purified splenic B cells from wild-type (n = 3) or kika (n = 3) mice cultured with anti-IgM (10 µg ml−1) for 20 h. The bars represent the median values and each dot represents a single mouse. These results are representative of n = 2 (c, e, f, h) or n = 3 (d, g) independent experiments. Experiments in a–e were performed once with n > 25 mice, and experiments in j–n were performed once with n = 4 HC-teens, n = 3 HC-adults and n = 1 patient. Statistical analysis was performed using unpaired t-tests (a); one-way ANOVA with Tukey multiple-comparison test (c, d, h); and two-way ANOVA with Tukey multiple-comparison test (b, g). Exact P values are shown. NS, not significant.

