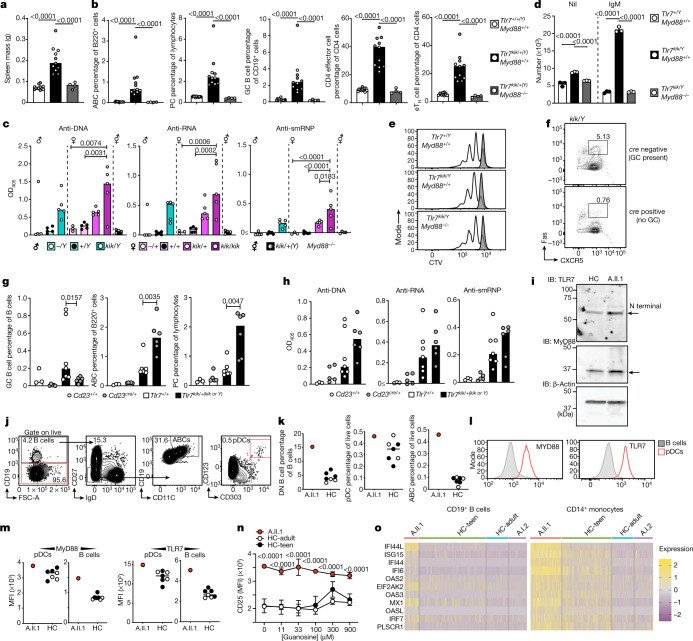
Fig. 4. TLR7-mediated autoimmunity is MyD88 dependent.
a, b, Spleen mass (a) and flow cytometry quantification (b) of ABCs (B220+CD21−CXCR5−CD19highCD11c+), plasma cells (CD138+CD98+), GC B cells (CD19+CD95+BCL6+), CD4 effector/memory T cells (CD4+FOXP3−CD44+) and extrafollicular helper cells (CD4+CXCR5−PD1+CXCR3+) from splenocytes of male (grey) and female (white) kika mice (aged 12 weeks) either sufficient or deficient in MyD88. c, Auto-antibodies to ssDNA (ANAs), ssRNA and smRNP from kika mice (aged 12 weeks) either deficient or sufficient in MyD88. d, e, Survival (d) and proliferation (e) of CTV-labelled splenic B cells cultured for 72 h with anti-IgM (white) or unstimulated (grey). f, g, Flow cytometry plots (f) and quantification (g) of splenic GC B cells (CD19+CD95+CXCR5+), ABCs and plasma cells from kika or control littermates (aged 10 weeks) either deficient (Bcl6flox/flox;Cd23cre) or sufficient (Bcl6flox/flox) in GCs (Cd23+/+ n = 3, Cd23cre/+ n = 5, Tlr7+/+ n = 7, Tlr7kik/+(kik or Y)n = 6). h, Serum autoantibodies to ssDNA, ssRNA and smRNP in the same mice as in g. i, Western blots showing TLR7 and MyD88 expression in PBMCs from A.II.1 and an age- and gender-matched healthy control individual (HC). j, k, Flow cytometry plots (j) and quantification (k) of the DN B cell, pDC and ABC phenotype in PBMCs from healthy control individuals (n = 7) and A.II.1. l, Quantification histograms of TLR7 and MyD88 protein in healthy control individuals and A.II.1. m, Mean fluorescence intensity (MFI) of MyD88 and TLR7 protein expression in plasmacytoid dendritic cells (pDC) and B cells in healthy control individuals and A.II.1. n, Quantification of CD25 expression in CD14+ monocytes after dose stimulations with guanosine. Data are mean ± s.d. o, Type I IFN signature of healthy control individuals (HC-teen and HC-adult), A.I.2 and A.II.1. The bars represent the median values and each dot represents a single mouse. The results represent n = 2 (f–i), or n = 1 (a–e, k–o), independent experiments. Experiments in a–e were performed once with n > 25 mice, and experiments in j–n were performed once with n = 4 HC-teens, n = 3 HC-adults, n = 1 patient. Statistical analysis was performed using one-way ANOVA with Tukey multiple-comparison test (a–c); Mann–Whitney U-tests (g); and two-way ANOVA with Tukey multiple-comparison test (d, n). Exact P values are shown.

