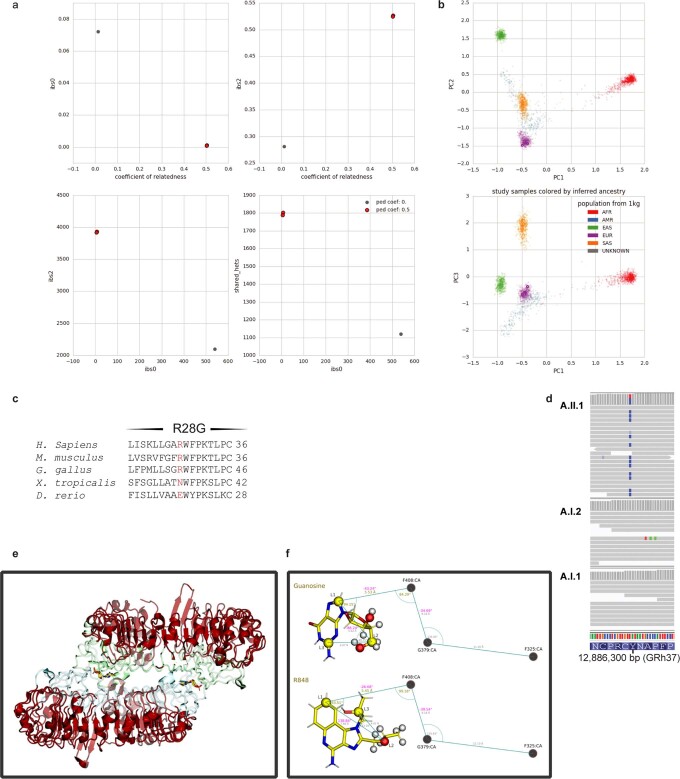
Extended Data Fig. 1. Confirmation of paternity in trio of proband with TLR7 de novo variant and methods for molecular modelling.
(a) Peddy diagrams used to establish relatedness. Each red dot represents a child/parent pair (child mother and child father). The grey dot is a no-relatedness control. Coefficient of relatedness should be 0.5 for a parent-child pair. ibs0: the number of sites at which the 2 samples shared no alleles (should approach 0 for parent-child pairs). ibs2: the number of sites in which the child vs parent samples where both hom-ref, both het, or both hom-alt. Shared_hets: the number of sites at which both child and parent samples were hets. (b) Ancestry check using Peddy (proband and parents are purple dots). (c) Phylogenetic conservation of TLR7 variants. (d) Integrative Genomics Viewer (IGV) image of the Y264H TLR7 de novo variant. (e) TLR7 structure 6IF5. Regions in red were restrained through all simulations with a harmonic restraint of force constant 5 kcal/mol/Å2, and correspond to residue numbers: 27-96, 116-179, 193-256, 281-297, 304-321, 327-346, 361-376, 385-403, 412-427, 434-460, 476-499, 510-523, 534-548, 561-572, 591-602, 616-625, 646-656, 671-681 and 699-835. (f) Guanosine and R848 illustrated with binding geometries from crystal structures 5GMF and 5GMH14. L1-L3 indicate ligand atoms used for Boresch restraints, which were restrained relative to the three depicted protein alpha carbons of residues F408, G379 and F325 (not to scale). Distances and angles in gold, and dihedrals in pink show the values for the 6DoF Boresch restraints. Additional geometric relationships between the restrained atoms, as measured from the starting structure, are shown in grey smaller print. Boresch dihedral restraints are relative to the two atoms connecting either side of the location of print. White hydrogen spheres and red oxygen spheres show the atoms used in the calculation for determining the number of waters within 3.5 Å of the tail region that each ligand interacted with.

