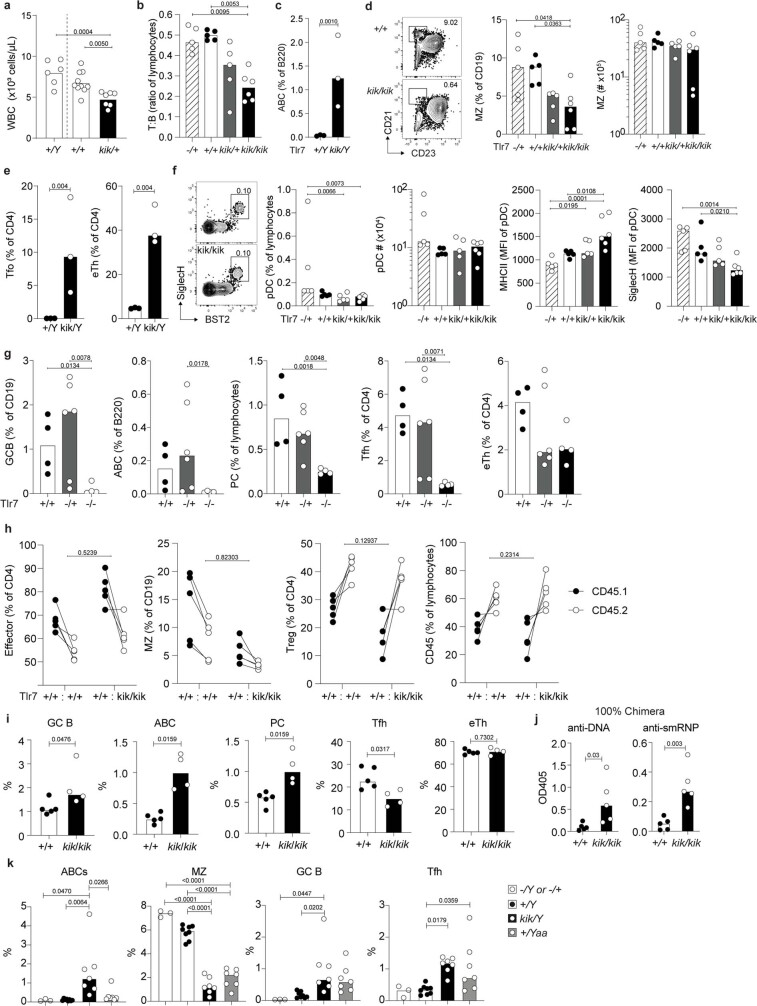
Extended Data Fig. 5. Cellular phenotypes in blood and spleen from kika mice, TLR7-deficient mice, mixed chimeras and Yaa mice.
(a) White blood cell (WBC) count in 18-wk old mice. (b, c) Flow cytometric plots and quantification. (b) Spleen T (CD3+):B (B220+) cell ratio from 12-wk old kika mice. (c) Age-associated B cells (ABC, B220+ CD21− CD23− CD19hi CD11c+) in blood from 18-wk-old kika mice. (d) Splenic marginal zone (MZ) B cells (CD19+ CD23− CD21+) in 12-wk kika mice. (e) Circulating T follicular cells (Tfo, CD4+ CXCR5+ PD1hi) and extrafollicular helper T cells (eTH, CD4+ CXCR5− PD1+ CXCR3+) in blood from 18-wk-old kika mice. (f) Plasmacytoid dendritic cellc (pDCs, CD3− CD19− MHCII+ CD11c+ CD11b- CD8− SiglecH+ BST2+) and pDC MFI of MHCII and SiglecH from 12-week-old kika mice. (g) Splenic germinal center B cells (GCB, CD19+ CD95+ BCL6+), ABC (B220+ CD21− CXCR5− CD19hi CD11c+), TFH (CD4+ CXCR5+ PD1hi), eTH (CD4+ CXCR5− PD1+ CXCR3+) and plasma cells (PC, CD138+ CD98+) from 24-wk TLR7-deficient mice. (h, i) Splenic cell subsets from mixed bone marrow chimeric mice containing a 1:1 ratio of control Tlr7+/+ CD45.1/Tlr7+/+ CD45.2 or Tlr7+/+ CD45.1/Tlr7kik/kik CD45.2 bone marrow (h) and 100% mixed bone marrow (i) of each genotype. Subsets shown are CD4 effector (CD4+ FoxP3− CD44+), MZ (CD19+ CD23− CD21+), Treg (CD4+ FoxP3+) and CD45.1 to CD45.2 reconstitution ratio, 22-weeks post-reconstitution. (j) Autoantibodies to DNA and smRNP in serum from 100% chimeric mice model. (k) Splenic cell subsets from kika and Yaa mice. Bars represent medians and each dot a single mouse. These results are representative of one blood ADVIA analysis, two experiments for blood flow cytometry, four splenic phenotyping for kika mice and one for TLR7 deletion mice, and one experiment for chimera analysis. One-way ANOVA with Tukey (a–g, k); Two-way ANOVA (h); Mann-Whitney (i); Unpaired t-test (j); Exact p values are shown.

