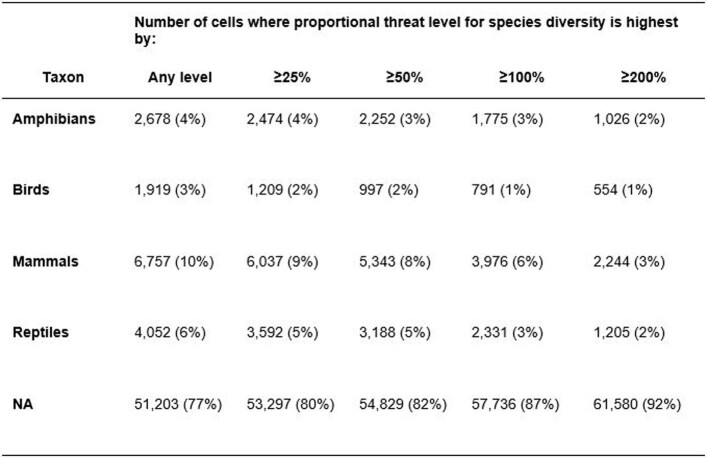
Extended Data Table 1.
Sensitivity analysis for proportional threat level differences
Influence of choice of threshold for proportional threat level difference between the most and second most proportionately threatened class on the absolute and relative number of grid cells identified as disproportionately threatened for species diversity across the four tetrapod classes. Provided in brackets are the percentage of all global terrestrial cells (71,605 in total) that are either attributed to the given class or assigned NA if no class is identified as disproportionately threatened using the corresponding threat level. Note that in the main text, we report results for the 100% or more threat level.

