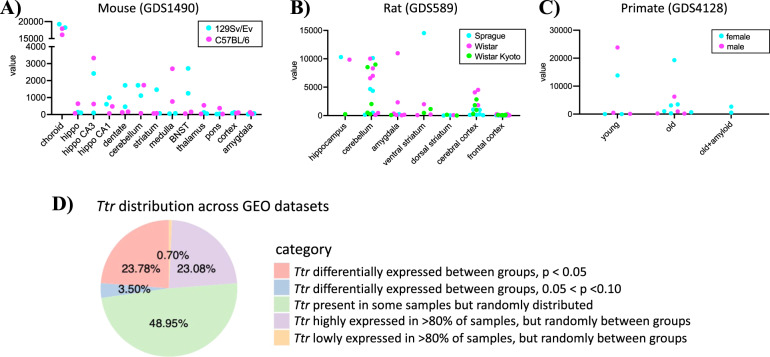
Fig. 2. Ttr expression in GEO profiles reveals potential between-group contamination biases.
A Ttr expression in several Mus musculus brain regions from 129SV/EV (teal) and C57BL/6 (magenta) lines from GEO profile GDS1490. Each point represents a sample. The GDS1490 study shows Ttr to be highly expressed in the choroid plexus tissue, followed by the hippocampus and the cerebellum. B GEO dataset GDS589 of rat brain regions from Sprague Dawley (teal), Wistar (magenta), and Wistar Kyoto (lime) strains shows a wide range of Ttr expression in numerous brain regions, with the highest observed in the ventral striatum. Each point represents a sample. Sprague Dawley and Wistar rats have >40× higher expression of Ttr in the hippocampus compared to Wistar Kyoto rats. C Ttr expression in the temporal cortex from the gray mouse lemur (Microcebus murinus) from GEO dataset GDS4128 shows an enormous range in expression among samples with a young female (teal) and a male (magenta) sample showing several orders higher expression for Ttr compared to the other young male and female samples within the same group. Each point on the plot represents a sample. Finally, D Ttr distribution across 143 GEO profiles shows between-group TTR/Ttr expression differences and that the majority of the studies surveyed show within-dataset expression variability for TTR/Ttr expression.

