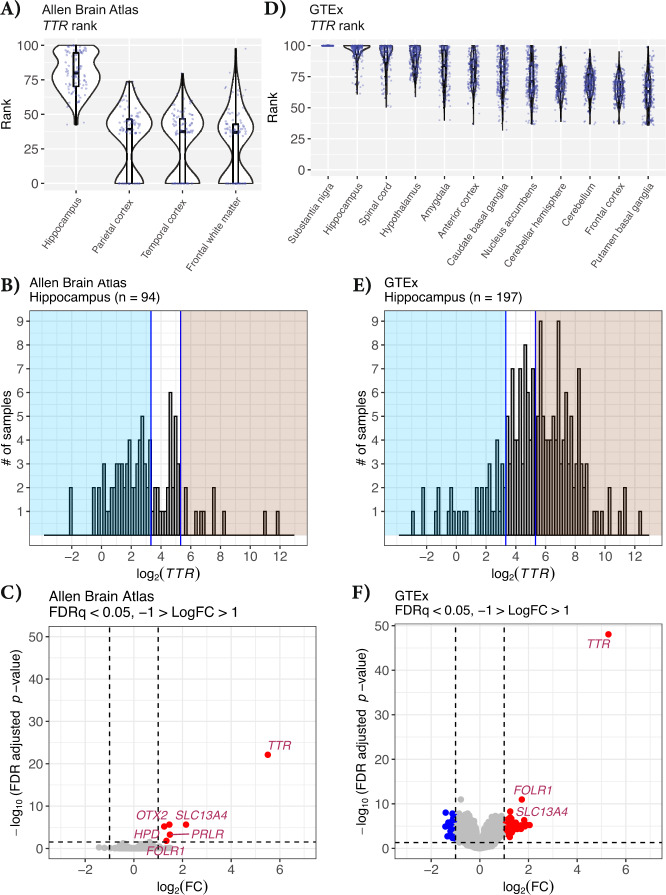
Fig. 3. TTR percentile rank for regions in the human brain.
Violin jitter of TTR percentile rank for each brain region in: A The Allen Brain Atlas data and B GTEx. The highest mean TTR percentile rank in the Allen Brain Atlas data is observed in the hippocampus. The highest mean TTR percentile rank observed in the GTEx data is substantia nigra and hippocampus. C Histogram of the log2(TTR) expression among hippocampus samples within the Allen Brain Atlas data and D GTEx. The left blue-shaded regions indicate the samples that likely do not have choroid plexus contamination, log2(TTR) < 3.32. The right red-shaded region indicates samples that potentially have choroid plexus contamination, log2(TTR) > 5.32. E Volcano plot showing the gene differential expression between the potentially contaminated and likely not contaminated Allen Brain Atlas hippocampus samples (n = 68) and F GTEx hippocampus samples (n = 97). Vertical lines show the log2 fold change of 1 and −1. Horizontal line indicates the adjusted p value cutoff of 0.05. Six genes are upregulated in the potentially contaminated group, adjusted p value < 0.05 and absolute log2 fold change > 1. Each point represents a gene, points in blue are downregulated, FDRq < 0.05 and the log2 fold change less than −1. Upregulated genes are indicated in red, FDRq < 0.05 and the log2 fold change greater than 1. Genes that are not differentially expressed are shown in gray.

