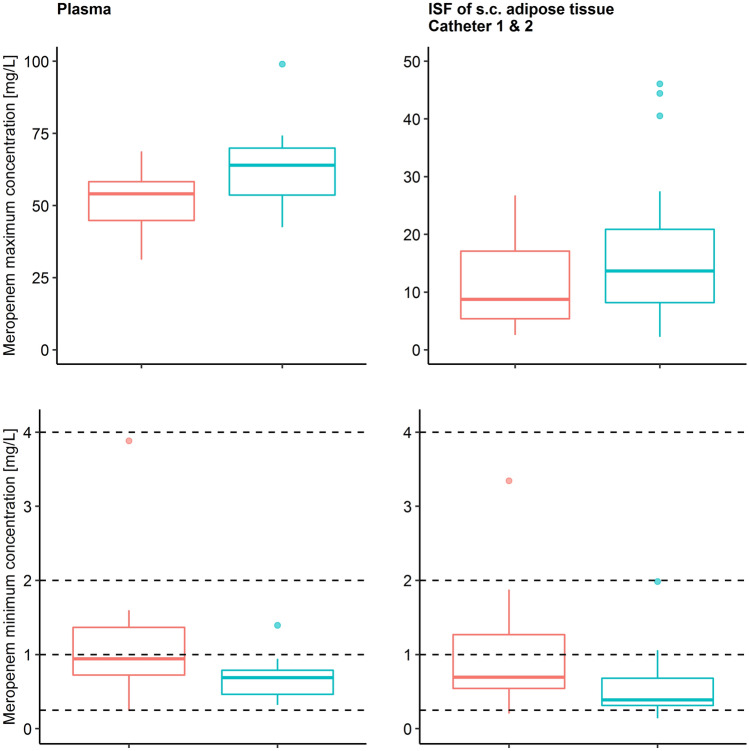
Fig. 1.
Observed maximum (top panel) and minimum (bottom panel) meropenem concentrations in plasma (total) and in the interstitial space fluid of subcutaneous adipose tissue obtained via microdialysis (unbound) using two catheters for obese (red, n = 15) and non-obese (green, n = 15) patients. Boxplots show the second to third quartile (box) and observations within (whiskers) and outside (dots) the interquartile range. Dashed horizontal lines indicate the minimum inhibitory concentrations. ISF interstitial space fluid, s.c. subcutaneous

