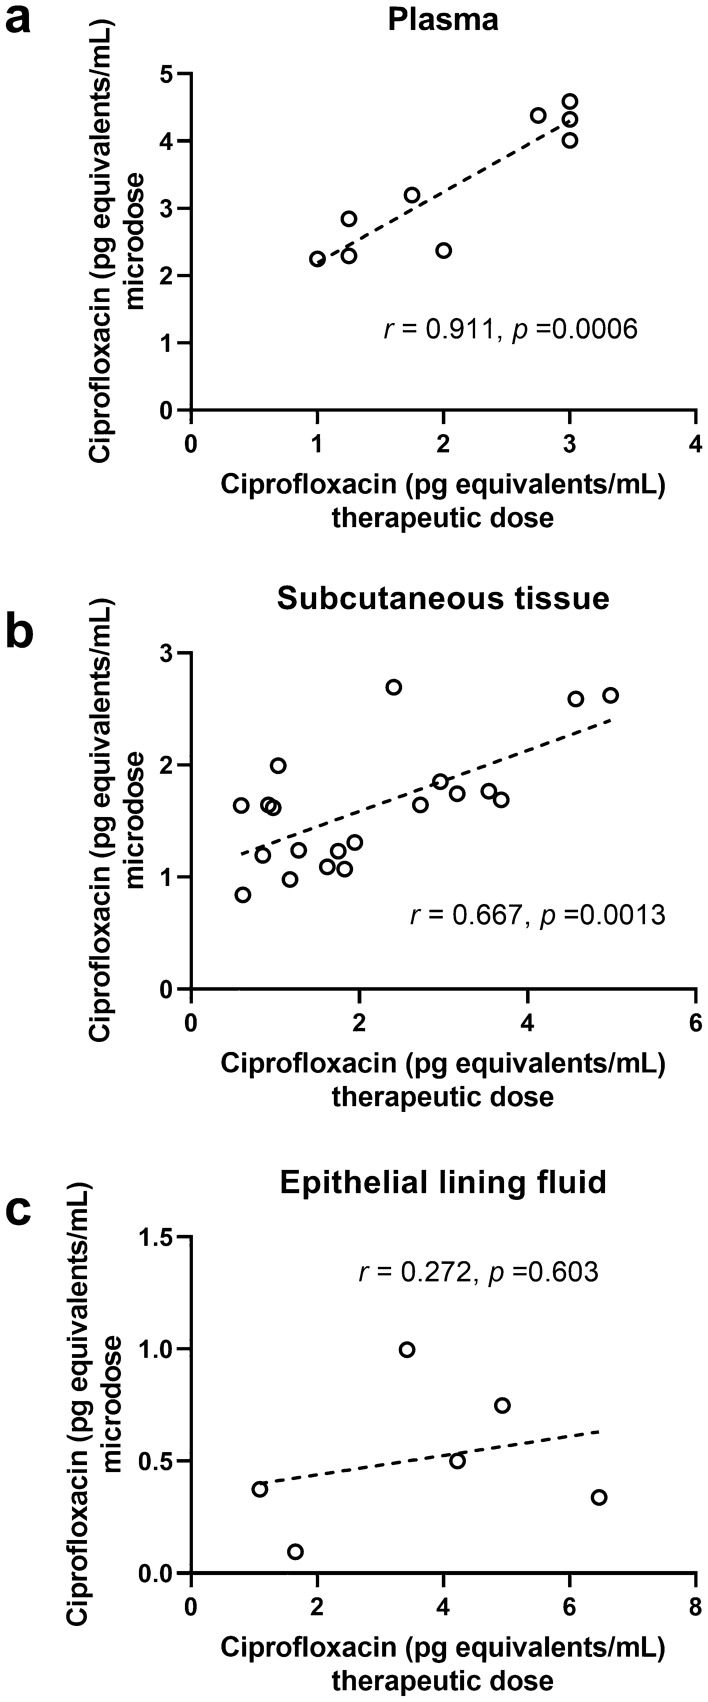
Fig. 3.
Correlations of dose-adjusted microdose ciprofloxacin concentrations determined with accelerator mass spectrometry and dose-adjusted therapeutic-dose ciprofloxacin concentrations quantified with liquid chromatography–tandem mass spectrometry in a plasma, b subcutaneous tissue, and c epithelial lining fluid in subjects of cohort A (r Pearson’s coefficient of correlation). To enable comparison of therapeutic-dose and microdose ciprofloxacin concentrations, values were normalized to the administered dose and expressed as pg equivalents per mL

