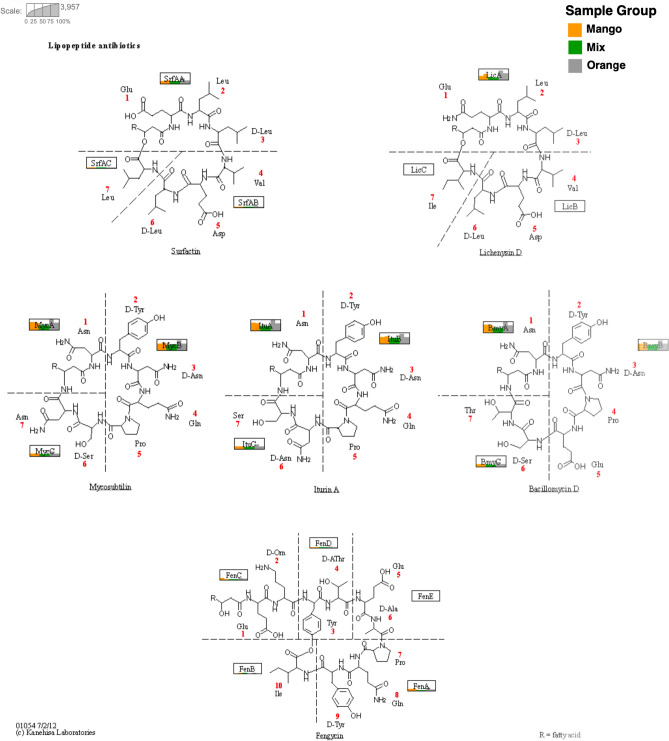
Figure 3.
For each of the six fruit-based samples, we indicate the number of reads assigned to the different genes involved in non-ribosomal synthesis. The illustration is based on KEGG pathway ko01054 “Nonribosomal peptide structures”24. Each gene is represented by a rectangle and inside each rectangle we use a bar chart to indicate the number of reads assigned from each of the six samples, namely Mango-1 and Mango-2 (yellow), Mix-1 and Mix2 (green) and Orange-1 and Orange-2 (gray).

