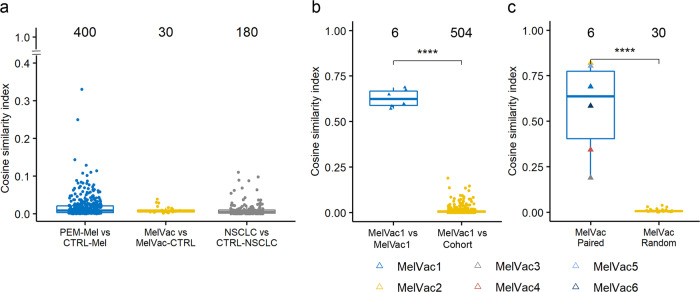
Fig. 1. Top antibody response is individual-specific.
a–c The top antibody response was analyzed using cosine similarity indices (CSI) by comparing the composition and abundance values of the 2500 most IgG-bound peptides in each sample to that of the rest of the cohort in pairs (Supplementary Data 1). CSI values (range from 0 to 1, y-axis) between samples belonging to the indicated groups (x-axis) are depicted. Numbers above boxplots indicate the number of comparison pairs shown as dots. Comparisons of samples to themselves (CSI = 1) are not depicted. Comparisons between different individuals are indicated with circles while, comparison of the samples of the same patient are indicated with triangles. a Pairwise comparison between study groups and their matched controls. PEM-Mel – melanoma patients receiving pembrolizumab treatment (n = 5); CTRL-Mel – healthy controls for melanoma group (n = 80); MelVac – NSCLC patients who received MelCancerVac® vaccine (n = 6); MelVac-CTRL – paired samples of MelVac group taken before vaccination (n = 6); NSCLC – non-small cell lung cancer patients (n = 18); CTRL-NSCLC – non-cancer controls for NSCLC group (n = 10). b Pairwise comparisons of the 4 longitudinal samples of one NSCLC patient, who received 35 doses of MelCancerVac® and remained with stable disease (Supplementary Table 2), to the 4 samples themselves (MelVac1 vs MelVac1) and to the rest of the study cohort (n = 126 samples, MelVac1 vs Cohort). c Pairwise comparisons of pre- and post-vaccination immunoprofiles of vaccinated NSCLC patients (n = 6). MelVac Paired – comparison of pre- and post-vaccination samples of the same patient; MelVac Random - comparison of the pre-vaccination sample of one patient to the post-vaccination samples of all 5 other patients. Two-sided Wilcoxon Rank Sum test, **** p < 0.0001, p-values not adjusted for multiple comparisons.

