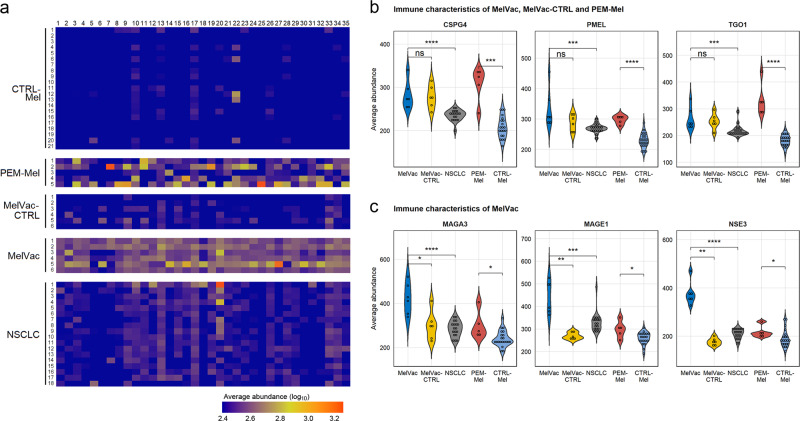
Fig. 3. Individual-specific immunoprofiles of antibody response to melanoma-associated antigens.
a Heatmap showing the antibody response to melanoma-antigens in patients with cancer and in the controls. Log10-transformation of the average abundance of the IgG-bound peptides containing epitopes with 100% identity to the indicated proteins are depicted. Value range ≤ 2.4 and ≥ 3.3 is provided for better visual representation. Group names of samples are depicted on the y-axis, individuals shown in numbers. x-axis indicates different melanoma-associated antigens (a total of 35 proteins) shown in Supplementary Table 3 and Supplementary Data 3. b, c Violin plots showing the average abundance of IgG-bound peptides containing epitopes with 100% identity to the specific proteins (shown above each graph, Supplementary Data 4) from panel a across study sub-cohorts. Two-sided Wilcoxon Rank Sum test, ns p > 0.5, *p < 0.05, **p < 0.01, *** p < 0.001, **** p < 0.0001, p-values not adjusted for multiple comparisons. CTRL-Mel – healthy controls for melanoma group (n = 21, all individuals older than 45 years); PEM-Mel – melanoma patients receiving pembrolizumab treatment (n = 5); MelVac-CTRL – paired samples of MelVac group taken before vaccination (n = 6); MelVac – NSCLC patients who received MelCancerVac® vaccine (n = 6); NSCLC – non-small cell lung cancer patients (n = 18).

