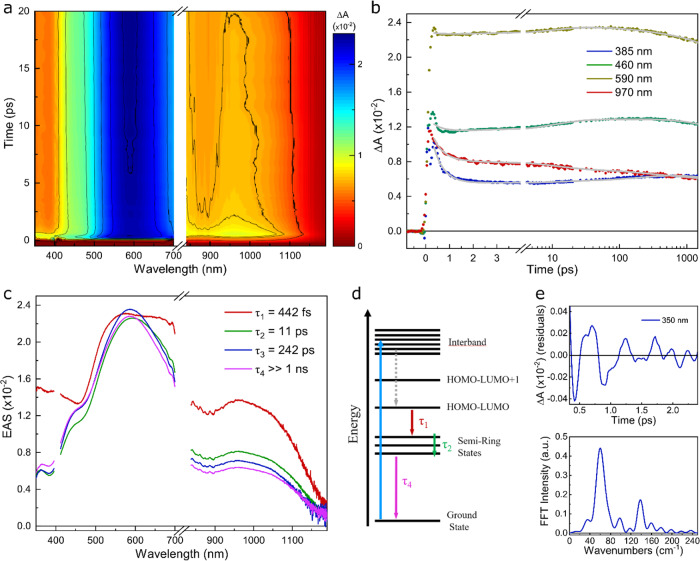
Fig. 3. Ultrafast spectroscopy of [Au25(SF27)18]0.
a ΔA map of the crystal solution in PFO as a function of probe delay and probe wavelength. b ΔA time traces selected at specific probe wavelengths. c EAS spectra obtained from global analysis fit. d Model of electronic energy relaxation following 400 nm pump excitation. e Extracted coherent oscillations from ΔA time trace measured at 350 nm probe wavelength, after subtraction of a bi-exponential decay and its corresponding Fourier transform spectrum.

