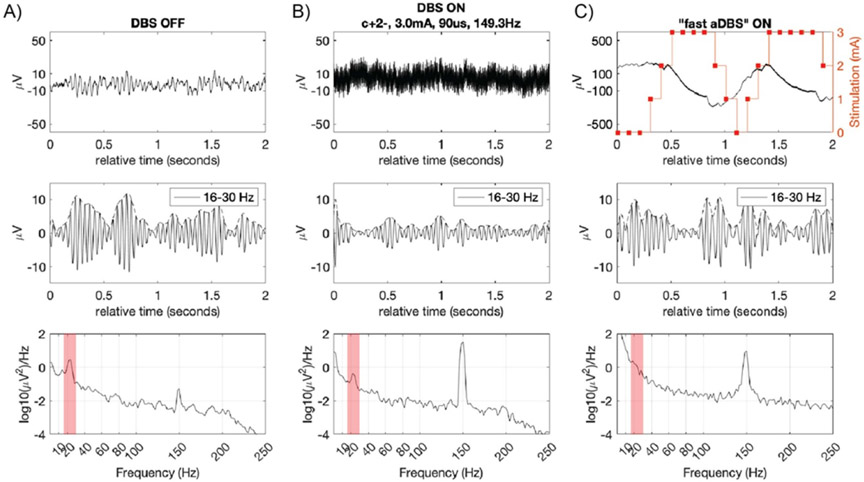
Figure 9.
Step response artifact on LFP signal during ‘fast’ stim ramping at 10 mA s−1. A 2 s segment of subcortical LFP recorded from pallidum of a PD patient for three different DBS settings: (A) DBS OFF, (B) DBS ON, and (C): ‘fast aDBS’. For each DBS state (column), the top row is the LFP time domain, middle row the band pass filtered signal and the bottom row is the PSD of the 2 s segment. Sandwiched sense configuration (C1 and C3 around stim contact C2). Stimulation 0–3 mA in 300 ms (ramp up = ramp down), 150 Hz frequency, 90 us. (A) DBS OFF: no neural stimulation which results in maximal amplitude of biomarker oscillation, ~10 microvolts peak (top (A) panel). (B) DBS ON: therapeutic open-loop stimulation (cathodic monopolar stim in C2 relative to IPG in chest, 3 mA, 149.3 Hz, 90 μs). (C) ‘Fast’ aDBS algorithm: top panel shows a time segment of raw LFP signal aligned with a time-varying stimulation amplitude (stimulation ramp 0–3 mA and 3–0 mA in 300 ms).

