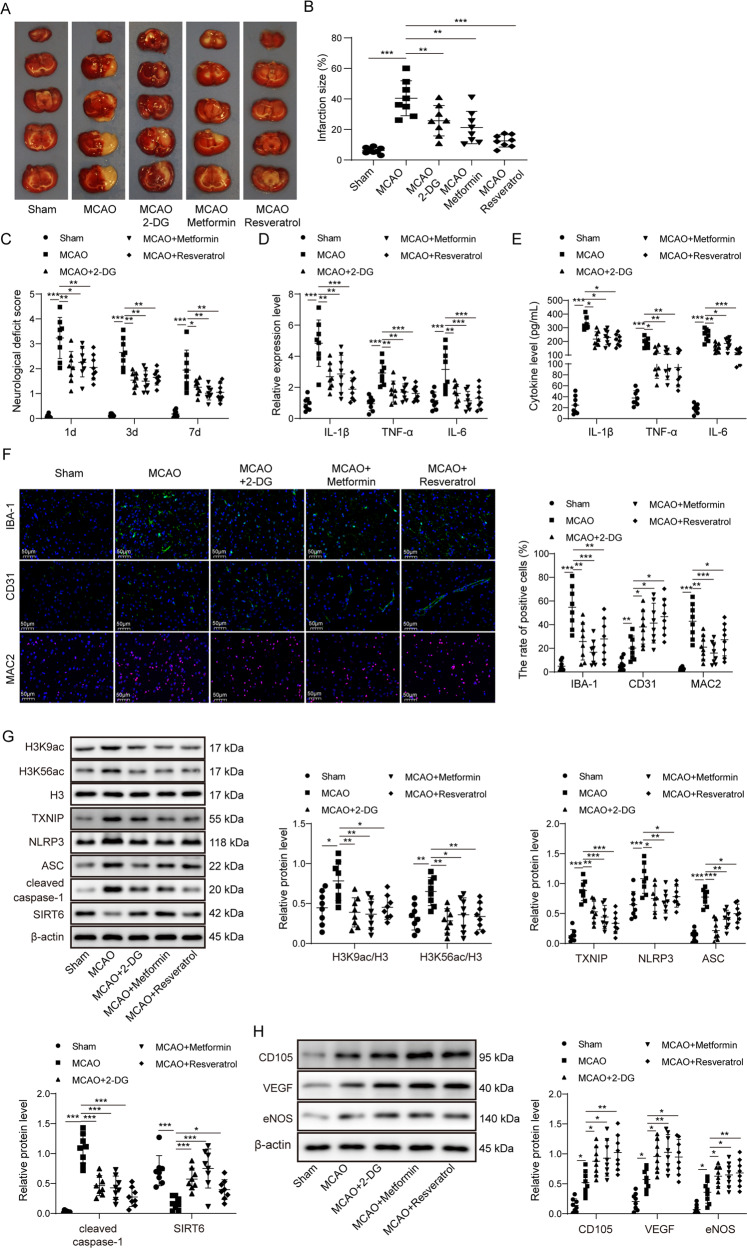
Fig. 2. ER mimetics exerted similar effects as IF in vivo.
A TTC stained sections illustrating normal (red) and infarct area (white). B The size of infarct area was expressed as percentage (%) of brain volume. C Neurological deficit scores using Longa scoring system. D, E The mRNA and serum levels of cytokines were determined by qRT-PCR and ELISA assay, respectively. F Immunofluorescence staining of IBA-1 (Green), CD31 (Green) and MAC2 (Red) in the peri-infarct cortex. Blue, DAPI. Scale bar = 50 μm. G, H The protein levels of target proteins were determined by Western blotting. β-actin acted as a loading control for Western blotting. For animal studies, n = 8/group. *p < 0.05, **p < 0.01, and ***p < 0.001.

