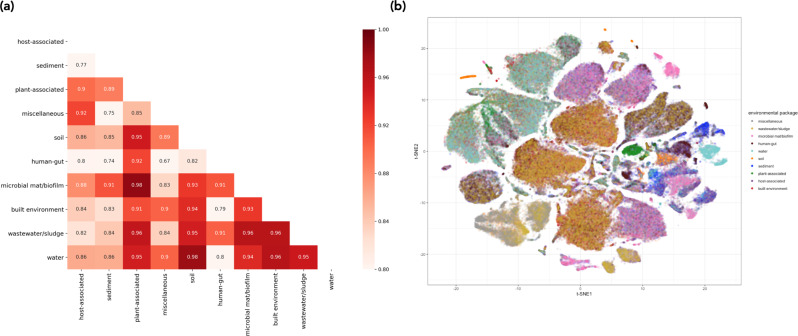
Fig. 3. Distributions of LookingGlass embeddings across environmental packages.
a Pairwise cosine similarity (in red) among the average embeddings of 20,000 randomly selected sequences from each environmental package. b t-SNE visualization of the embedding space for 20,000 randomly selected sequences from each of ten distinct environmental contexts in the “mi-faser functional” validation set. Sequences from the same environmental context generally cluster together. Colors indicate environmental package. Embeddings are significantly differentiated by environmental package (MANOVA P < 10−16). Source data are provided as a Source Data file.

