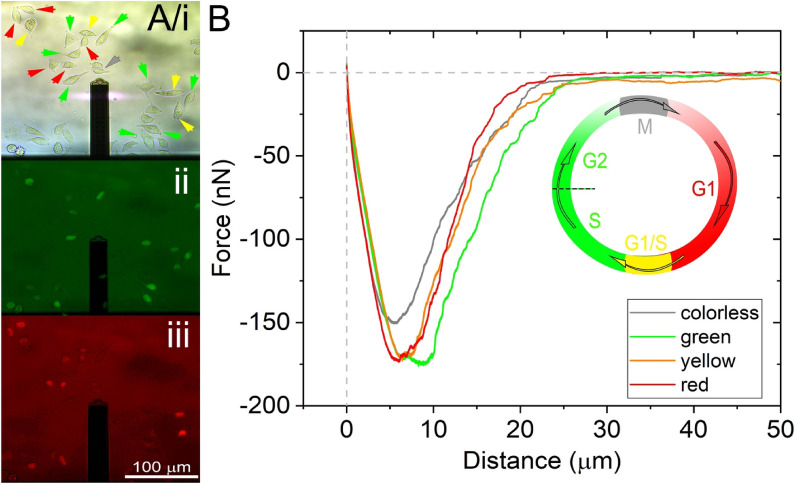
Figure 3.
The Fucci construct and the actual measurement when the FluidFM cantilever is approaching the targeted cell. (A) Schematics of the HeLa Fucci cycle indicate the colors visible during the different phases. Fluorescent images were taken during SCFS measurements on the FluidFM platform. Green and red fluorescent channels were visualized simultaneously, and according to their emitted light spectra, cells were labeled as green, red, yellow (green and red), and colorless. (B) Averaged characteristic SCFS FD-curves were obtained from each measurement belonging to different color phases of HeLa Fucci cells. Averaged FD-curve belonging to a single set of colors were calculated based on the position dependency (distance) of the force values of individual recordings at the same position. For the averaged FD-curves, 38 red cells, 43 yellow, 44 green, and 55 colorless cells were averaged, respectively. The inset shows the cell cycle phases and the actual cell colors.

