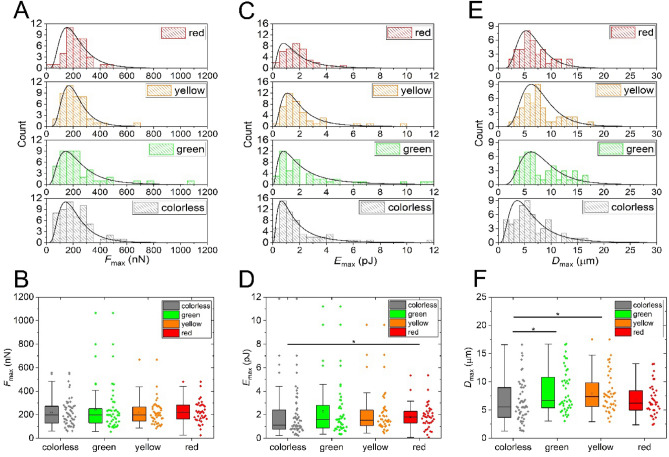
Figure 4.
Adhesion parameter distributions with respect to cell color are presented on histograms with lognormal distribution (A,C,E) and box charts (B,D,F). Parameters Fmax (A,B) and Emax (C,D) show no statistical difference between individual phase colors (except for a weak significance for the colorless-red Emax, see Table S1), but Dmax (E,F) presents a difference between colorless (M phase), green (G2 phase), and yellow (S phase) cells (p < 0.05). Fmax: colorless cells mean = 218 ± 16 nN; green cells mean = 252 ± 29 nN; yellow cells mean = 218 ± 16 nN; red cells mean = 222 ± 15 nN. Emax: colorless cells mean = 1.9 ± 0.3 pJ; green cells mean = 2.6 ± 0.4 pJ; yellow cells mean = 2.1 ± 0.3 pJ; red cells mean = 1.8 ± 0.2 pJ. Dmax: colorless cells mean = 6.4 ± 0.5 µm; green cells mean = 6.4 ± 1.8 µm; yellow cells mean = 8 ± 0.5 µm; red cells mean = 6.8 ± 0.5 µm.

