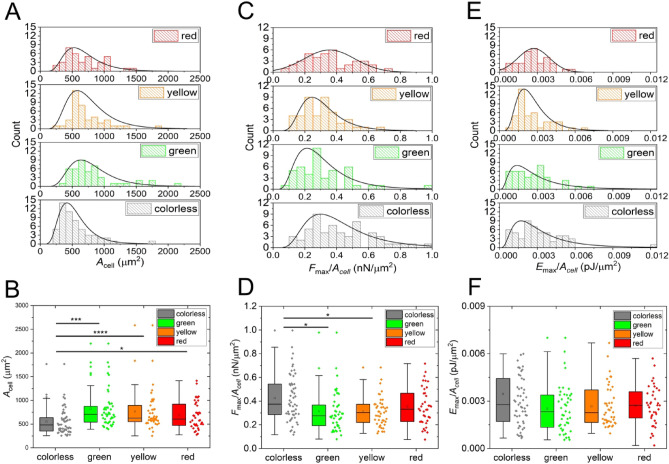
Figure 5.
Area (Acell) and its effect on the area normalized parameters (Fmax/Acell, Emax/Acell,) presented on histograms with fits of lognormal distributions (A,C,E) and box charts (B,D,F). A significant difference was found in the Acell between colorless cells and all other subpopulations (B). Also, the Fmax/Acell values between colorless cells, green and yellow cells were observed to be significantly different (D). Emax/Acell has not shown any difference in their distribution (F).

