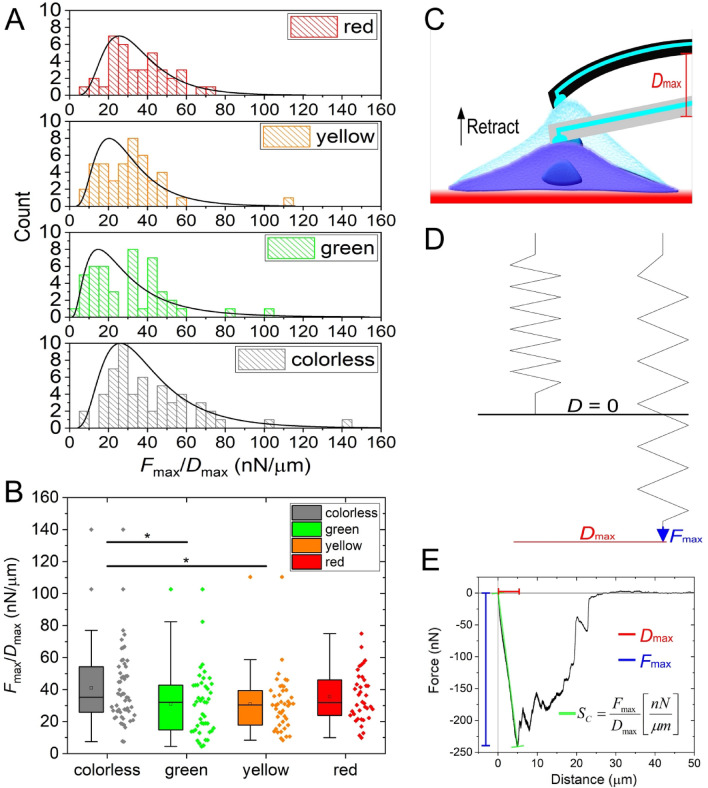
Figure 6.
Spring coefficient (Sc) characterizes the elasticity of the cell and the illustration of its physical meaning. Sc produced lognormal distributions in all color phases (A), and a significant difference between colorless, green, and yellow cells (B). The elastic capability of the cell shows a deformation upon pulling it from the surface with the FluidFM cantilever. Note the drawing is not in scale. In reality, the bending of the cantilever is small compared to the elongation of the cell. (C), which can be interpreted as the pulling of spring with a specific amount of force. The longest elongation Dmax is reached when pulling the cell with the maximum force Fmax (D). Thus the fraction Dmax and Fmax yields Sc, which is the linear slope connecting the maximal force–elongation with the zero level (E).

