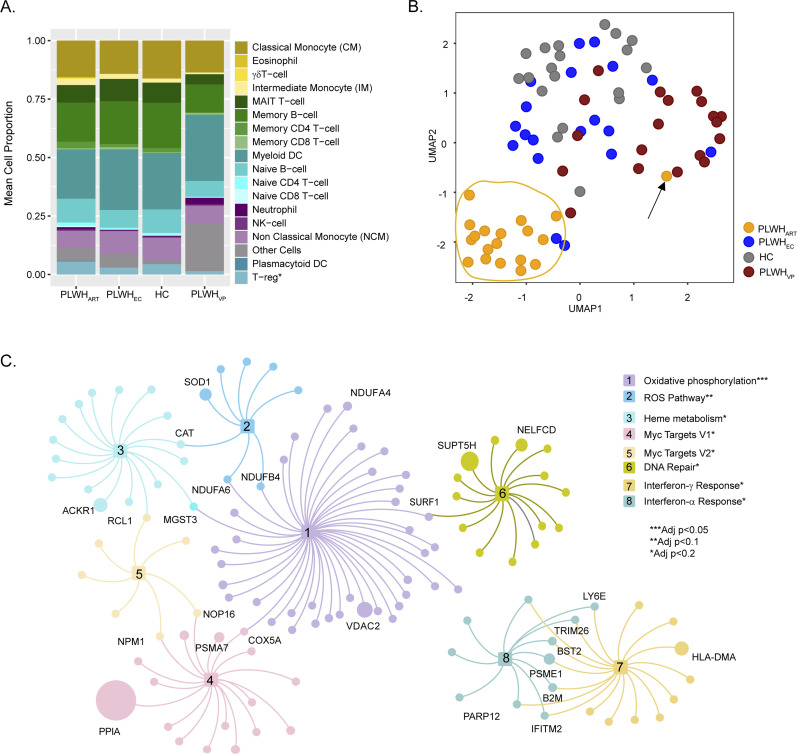
Figure 1. System-level transcriptomics signature in PLWHART.
(A) Digital cell-type quantification using Estimating the Proportions of Immune and Cancer cell (EPIC) methodology. Mean cell proportions estimated from the samples of each of the four cohorts are visualized in the bar graph. (B) Visualization of sample distribution using expression of combination antiretroviral therapy–specific genes and dimensionality reduction by UMAP. (C) Network visualization of pathways identified as significantly enriched by combination antiretroviral therapy–specific genes. Nodes are genes and edges represent association with pathways. Node size is relative to the mean expression of the genes among the PLWHART. Genes overlapping between pathways and high abundance genes are labeled.

