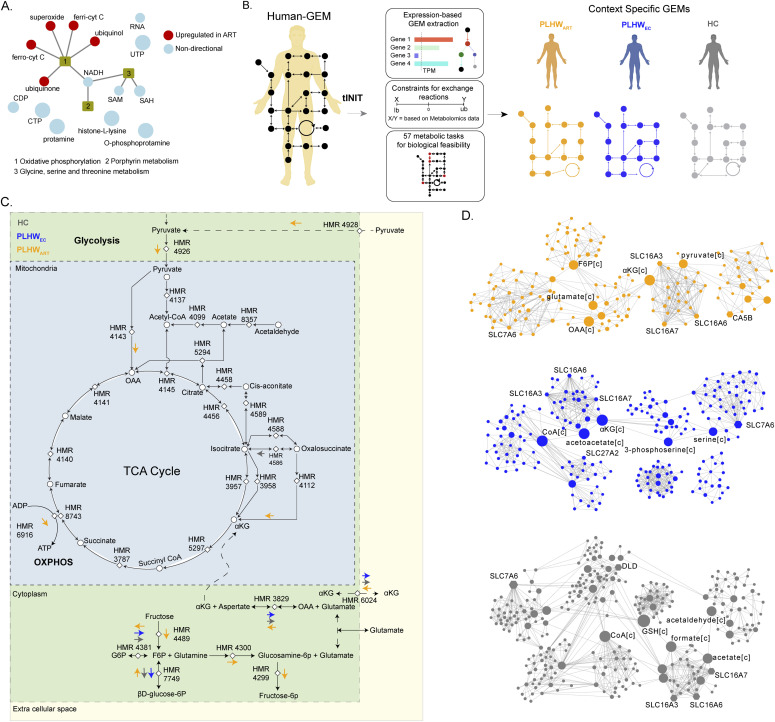
Figure 3. Context-specific genome-scale metabolic modeling and flux balance analysis.
(A) Network visualization of significant reporter metabolites (adjusted P < 0.2) identified in PLWHART versus PLWHEC. Red-colored nodes represent up-regulated reporter metabolites and steel-blue colored nodes represent dysregulated (non-directional) reporter metabolites. (B) Workflow diagram of context-specific genome-scale metabolic model reconstruction. (C) Reaction diagram showing flux balance analysis results. Reactions show specific flux changes in PLWHART compared with PLWHEC and HC cohorts highlighted with colored arrows. The direction of the arrow represents the flux change of the corresponding reaction in the cohort. (D) Communities identified from the topology analysis of the metabolic network in PLWHART, PLWHEC, and HC. Node size is relative to betweenness centrality measurement. The top five ranked genes and metabolites based on betweenness centrality are labeled.

