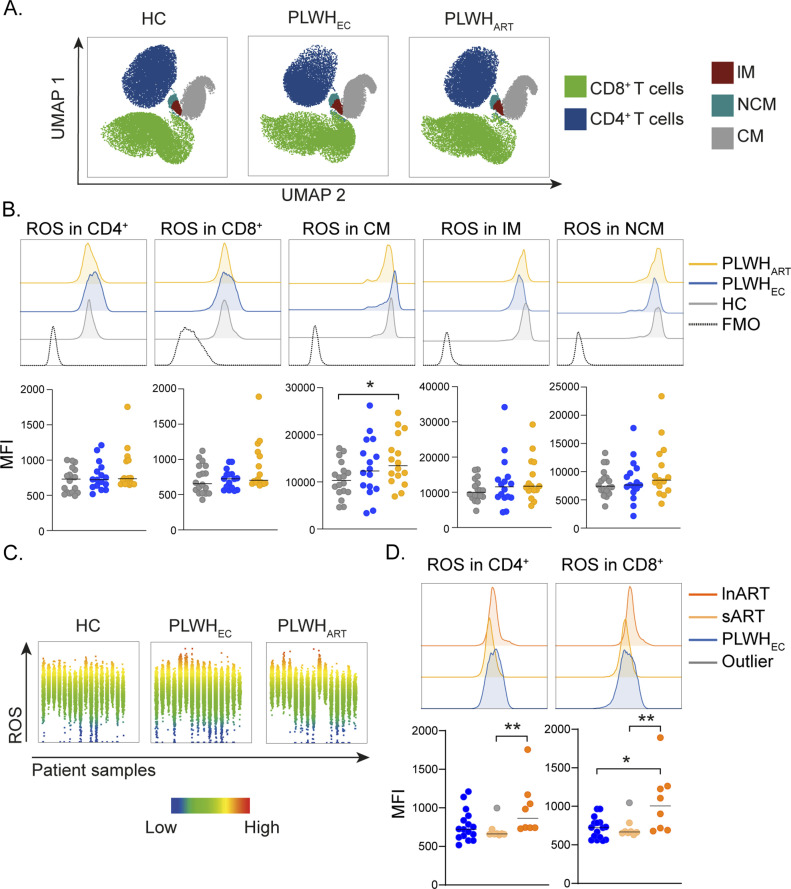
Figure 4. Redox homeostasis during suppressive viremia.
(A) Reactive oxygen species (ROS) detection in lymphocytic and monocytic cell populations from HC (n = 18), PLWHEC (n = 16), and PLWHART (n = 18). UMAP representation showing the distribution of lymphocytic (CD4+ and CD8+ T cells) and monocytic (classical monocytes [CM], intermediate monocytes [IM], and non-classical monocytes [NCM]) cell populations. (B) Median fluorescence intensity (MFI) of ROS in CD4+, CD8+, CM, IM, and NCM in the cohort. Histograms show a representative sample from HC, PLWHEC, and PLWHART exhibiting the median expression in each group. (C) Graphs showing MFI of ROS in each individual from HC, PLWHEC, and PLWHART. (D) MFI of ROS in PLWHEC (n = 16), short-term ART (sART, n = 8), and long-term ART (lnART, n = 8). Histograms show a representative sample from PLWHEC, sART, and lnART exhibiting the median expression in each group. Statistical significance was determined using Mann–Whitney U test (P < 0.05 with *<0.05, **<0.03, ***<0.002) and represented with median. See also Fig S3.

