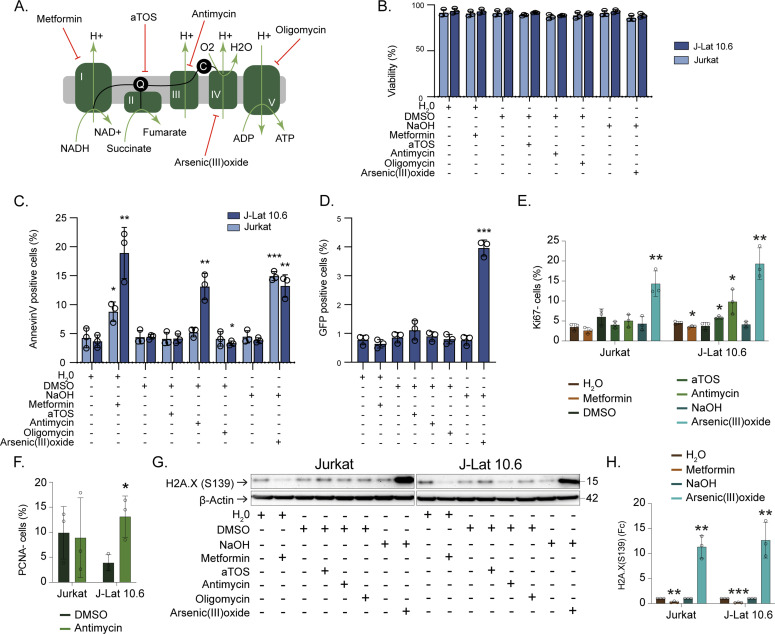
Figure 5. Pharmacological inhibition of OXPHOS in lymphocytic HIV-1 latency cell model.
(A) Schematic representation of inhibition of OXPHOS complexes with metformin (complex I), aTOS (complex II), antimycin (complex III), arsenic trioxide (complex IV), and oligomycin (complex V). (B) Drug toxicity for 24 h treatment of OXPHOS inhibitors. (C) Annexin V positive cells after treatment with OXPHOS inhibitors and respective controls. (D) Activation from latency in J-Lat 10.6 cells after treatment with OXPHOS inhibitors and respective controls. (E) Percentage Ki-67 negative cells after treatment with OXPHOS inhibitors or respective controls. (F) Percentage PCNA negative cells after treating with Antimycin or DMSO control. (G) Western blot detection of H2A.X (S139) and β-Actin in Jurkat and J-Lat 10.6 after treatment with OXPHOS inhibitors or respective controls. (H) Quantification of H2A.X (S139). The graph shows fold change (Fc) of protein expression in relation to respective control after normalization to β-Actin. Experiments were performed in three biological replicates. Significance was determined using two-tailed t test (P < 0.05 with * < 0.05, ** < 0.033, *** < 0.002) and represented with mean and SD. Significance for each drug is compared with respective control. See also Figs S4 and S5.
Source data are available online for this figure.

