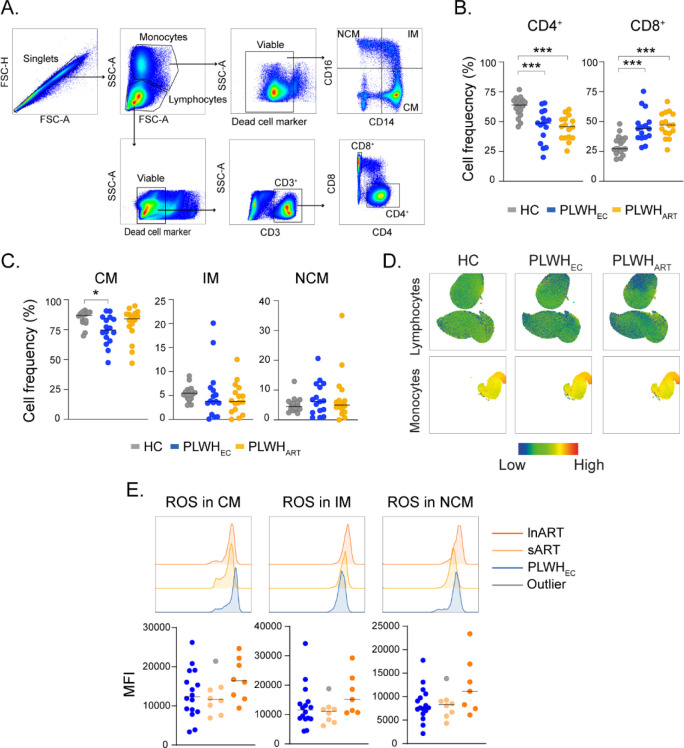
Figure S3. Flow cytometry analysis of reactive oxygen species (ROS) production in HC (n = 18), PLWHEC (n = 16), and PLWHART (n = 18).
Related to Fig 4. (A) Gating strategy for CD4+ T cells, CD8+ T cells, classical monocytes (CM), intermediate monocytes (IM), and non-classical monocytes (NCM) from total PBMCs. (B) Proportion of CD4+ and CD8+ T cells in HC, PLWHEC, and PLWHART. (C) Proportion of CM, IM, and NCM in HC, PLWHEC, and PLWHART. (D) UMAP shows the heat map distribution of ROS in HC, PLWHEC, and PLWHART in lymphocytic and monocytic cell populations. (E) MFI of ROS in monocytic cell populations from PLWHEC, short-term ART (<10 yr, n = 8), and long-term ART (>10 yr, n = 8). The histogram shows a representative sample from HC, PLWHEC, and PLWHART exhibiting the median expression in each group. Statistical significance was determined using Mann–Whitney U test (P < 0.05 with * < 0.05, ** < 0.033, *** < 0.002) and represented with the median.

