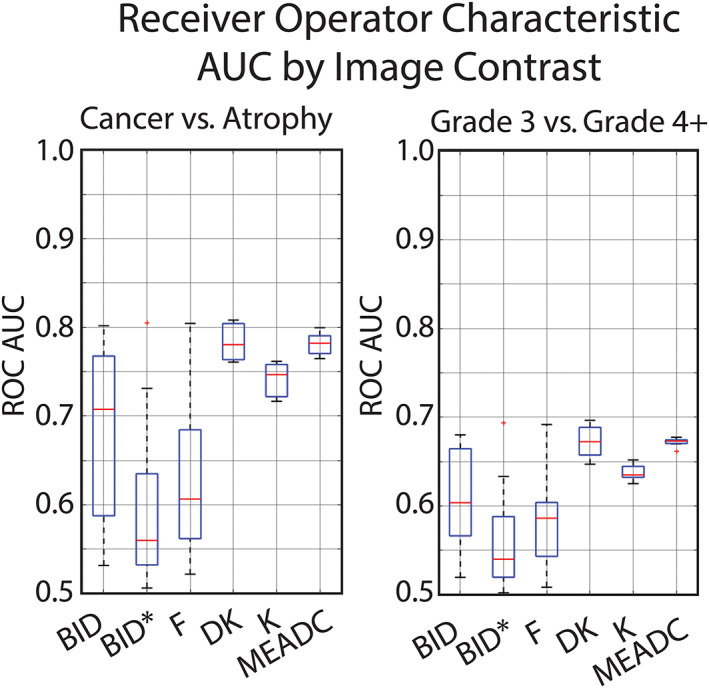
FIGURE 4.

Boxplot showing area under the curve receiver operating characteristic (ROC AUC) variability by site implemented fits. Left: Cancer (G3+) vs. benign atrophy. Right: Gleason 3 vs. Gleason 4+. ROC AUC was calculated lesion‐wise using the median value in each pathologist annotated region larger than 200 voxels. A tighter boxplot indicates less cancer differentiation variability between site implementations.
