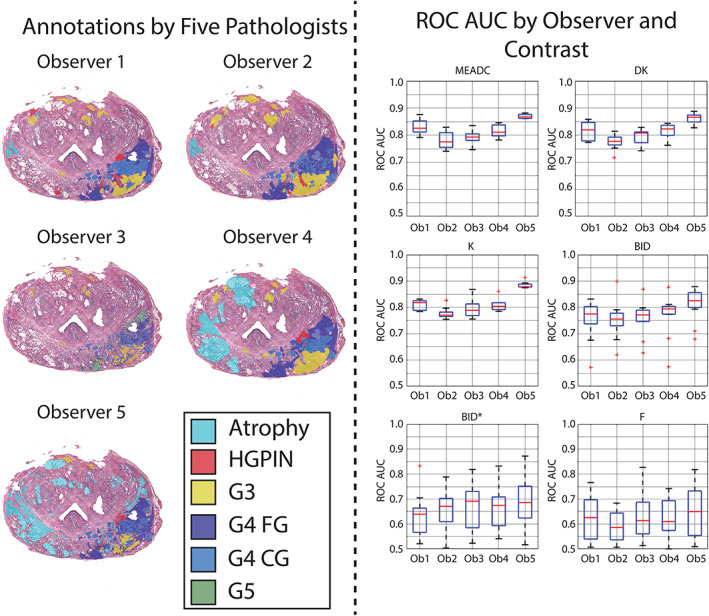
FIGURE 6.

Area under the curve receiver operator characteristic (ROC AUC) for cancer vs. regions left unlabeled by all pathologists (unlabeled consensus) annotations varying the pathologist annotating the slides. Left: Sample annotations from all five observers on a representative whole‐mount prostate slide. Right: Boxplots showing AUCs varying the image contrast and observer annotating the slides. Median values were extracted from regions of interest (ROIs) greater than 200 voxels in plane.
