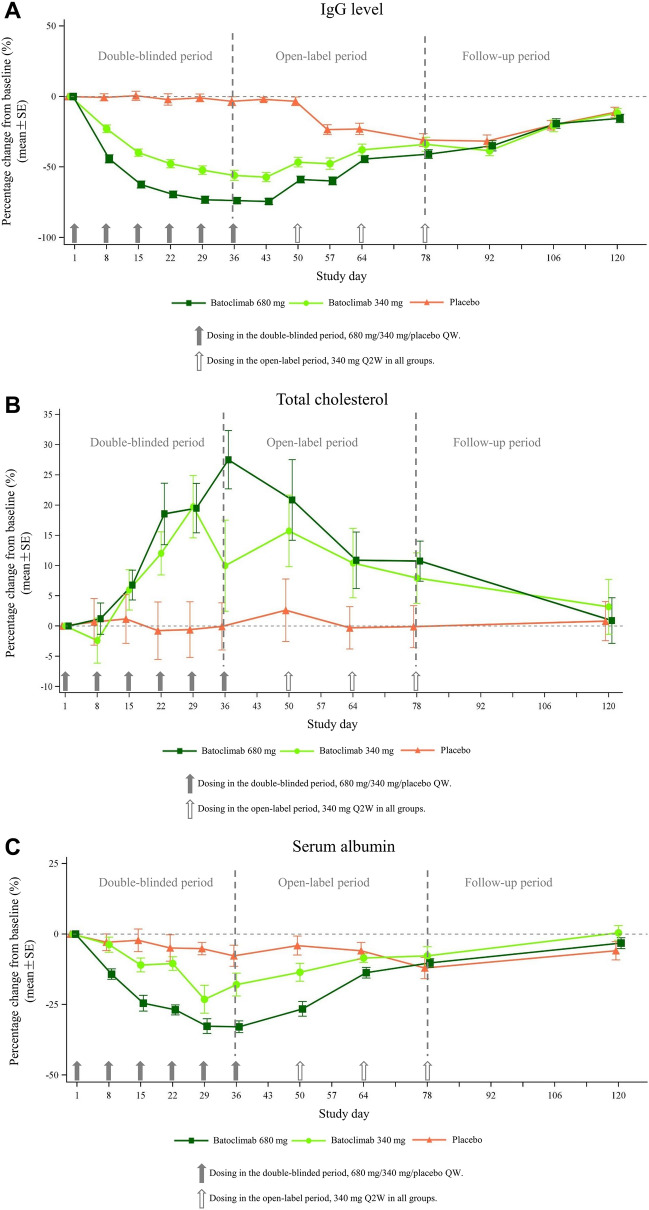
Fig. 3.
Changes in IgG, total cholesterol, and albumin levels. A Serum total immunoglobulin G (IgG) levels after batoclimab and placebo treatment over the whole study period. Values are mean ± standard error, expressed as the percentage change from baseline in IgG concentration. B Serum total cholesterol levels after batoclimab and placebo treatment over the whole study period. Values are mean ± standard error, expressed as serum total cholesterol concentration. C Serum total albumin levels after batoclimab and placebo treatment over the whole study period. Values are mean ± standard error, expressed as serum albumin concentration

