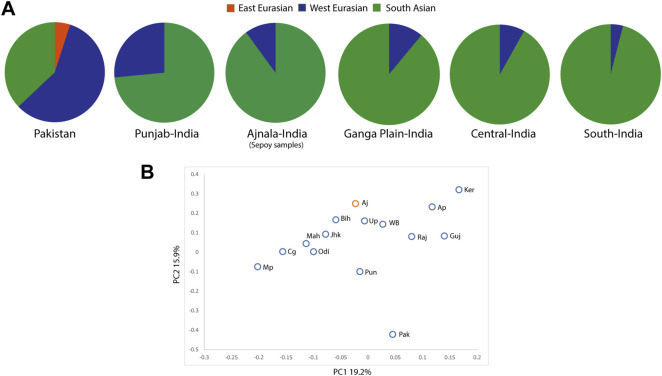
FIGURE 2.
(A) Pie chart showing the proportion of the East Eurasian, West Eurasian, and South Asian genetic ancestries among the studied group (Ajnala, India), with respect to their adjacent geographical regions. South Asian haplogroups: M2-M6, M18, M25, M30-M67, N5, R5-R8, R30-R32, and U2a,b; west Eurasian haplogroups: HV, H, J, K, R0, R1, R2, U1-U5, U7, U8, U9, W, and X; east Eurasian haplogroups: A-G, M7-M12, R22, and N9. (B) Principal component analysis (PCA) on maternal haplogroups of South Asian populations, showing the affinity of sepoy samples with South Asian populations. Pak, Pakistan; Pun, Punjab India; Aj, Ajnala (sepoy samples); Raj, Rajasthan; Guj, Gujarat; Mah, Maharashtra; Up, Uttar Pradesh; Bih, Bihar; Jhk, Jharkhand; WB, West Bengal; Mp, Madhya Pradesh; Cg, Chhattisgarh; Odi, Odisha; Ap, Andhra Pradesh; Ker, Kerala.

