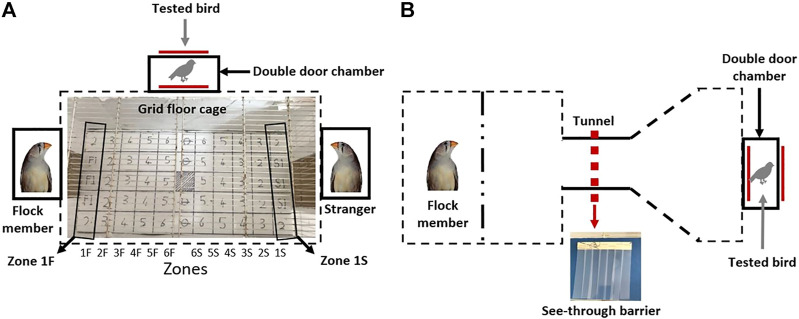
FIGURE 2.
A schematic depiction of the cages designed for the (A) social preference and (B) motivation tests. The grid with numbered squares that was printed on the main chamber floor in the cage of the social preference test is shown in (A). Each vertical line of squares was defined as a “zone”. Zones 1F and 1S are indicated as examples. See text for details.

