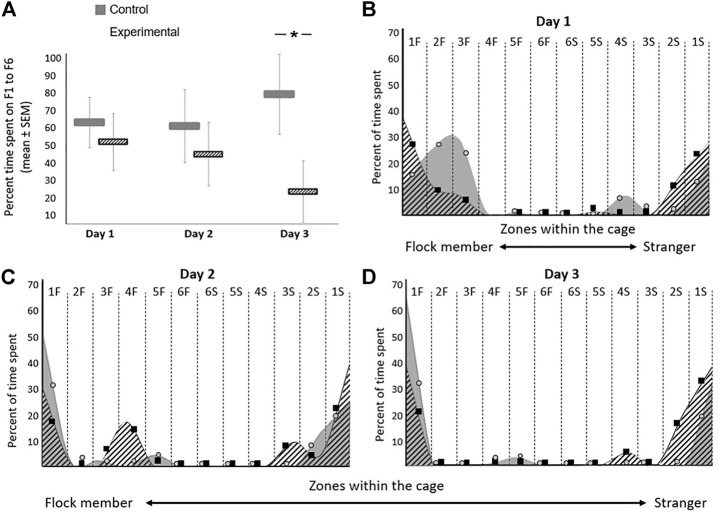
FIGURE 5.
Effect of GSK-3β inhibition on social recognition in zebra finches during the three days of the test. The average time spent on each day for both groups are presented. (A) Average percentage time spent (seconds ± SEM) in zones F1-F6 on days 1–3 of the test. (B–D) The percentage of time spent in each zone within the cage on each day of the experiment is represented with circles (control) and squares (experimental). A smoothing algorithm was used to present the data in a more uniform way overlapping the circles and squares. N = 6 birds/group; *p < 0.01.

