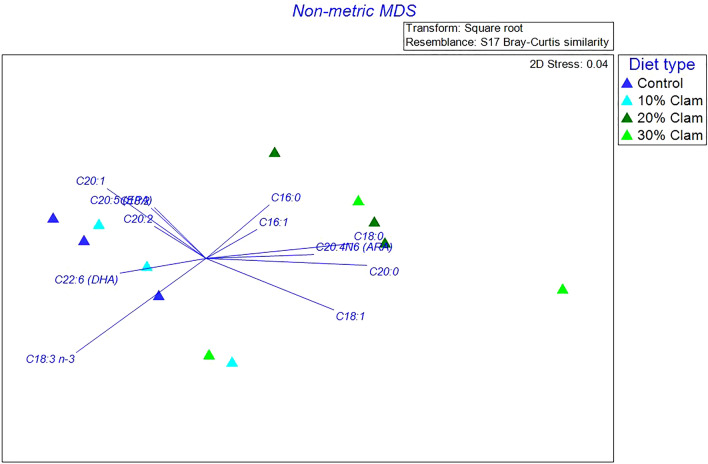
Figure 3.
Non-metric multidimensional scaling (n-MDS) of the Bray–Curtis similarity matrix based on the relative abundance of fatty acid profiles associated with diets fed to Florida pompano (Trachinotus carolinus) juveniles; control diet (dark blue triangles); 10% clam meal (CM) diet (light blue triangles); 20% CM diet (dark green triangles); and 30% CM diet (light green triangles). The n-MDS shows two main clusters: 1st cluster regroups diet samples from control and 10% CM; and the second cluster regroups diet samples from 20 and 30% CM diets. The arrows length and direction represent the fatty acids responsible for most of the variation.

