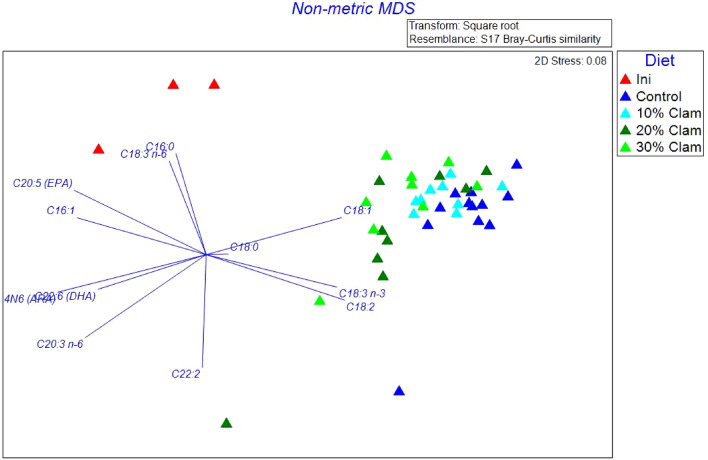
Figure 4.
Non-metric multidimensional scaling (n-MDS) of the Bray–Curtis similarity matrix based on the relative abundance of fatty acid profiles associated with Florida pompano (Trachinotus carolinus) juveniles at the start of the experiment (red triangles; Initial); juveniles fed a control diet (dark blue triangles); juveniles fed a 10% clam meal (CM) substitution diet (light blue triangles); juveniles fed a 20% CM substitution diet (dark green triangles); and juveniles fed a 30% CM substitution diet (light green triangles). The n-MDS shows two main clusters: 1st cluster regroups all juvenile samples issued from all four diets; and the second cluster (red triangles) regroups initial juvenile samples before the onset of the feed experiment. The arrows length and direction represent the fatty acids responsible for most of the variation.

