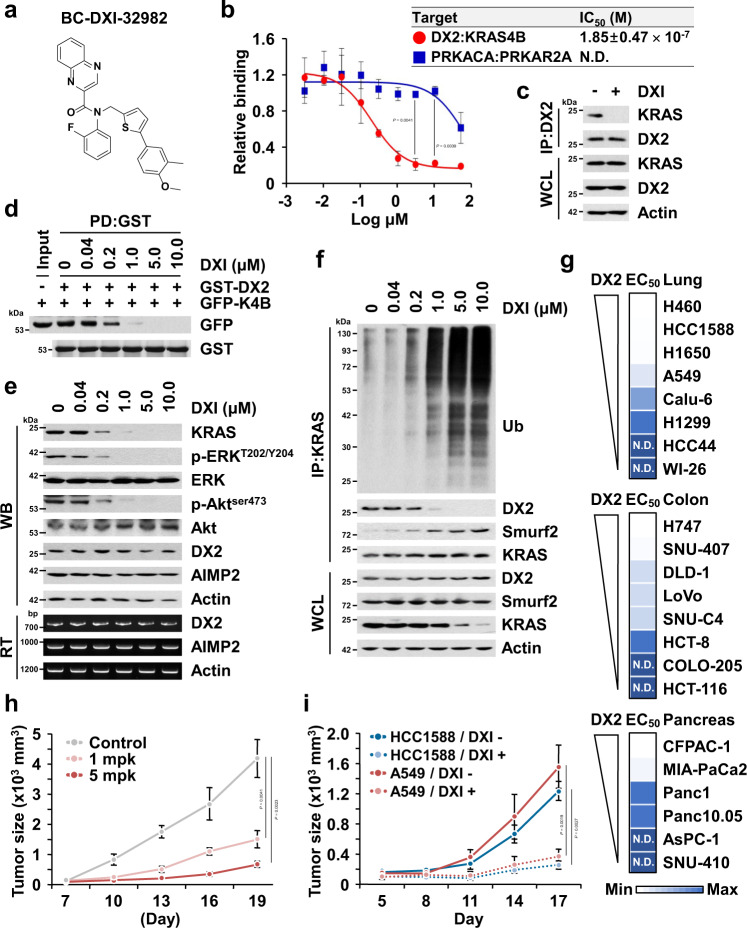
Fig. 5. Identification and characterization of BC-DXI-32982.
a Structure of BC-DXI-32982 (DXI hereafter). b Inhibitory effect of DXI on the binding of DX2 and KRAS4B. Binding pair of PRKACA and PRKAR2A was used for checking the binding specificity. N.D. denotes “not determined” in the tested range of dose. The experiment was independently repeated thrice and error bars denote S.D. Data are presented as mean values ± S.D. P value is from the two-sided t test. c Endogenous immunoprecipitation showing the interaction between DX2 and KRAS in H460 cells treated with DXI. Results are representative of at least three independent experiments. d In vitro pull-down assay showing direct inhibition of DXI on the binding of DX2 and KRAS4B. DXI was incubated with the mixture of cellular extracts expressing GFP-KRAS4B and the purified GST-DX2 proteins. Results are representative of at least three independent experiments. e Suppression of KRAS level via DXI. H460 cells treated with various concentration of DXI for 18 h were subjected to immunoblotting and RT-PCR. Results are representative of at least three independent experiments. f Ubiquitination assay analyzing DXI-mediated ubiquitination of KRAS. Results are representative of at least three independent experiments. g Heat map showing EC50 of DXI on lung, colorectal, and pancreatic cancer cell lines expressing different levels of DX2 (Supplementary Fig. 12a). In each type of cancers, the maximum and minimum EC50 values were represented as blue color with the highest and lowest intensity, respectively, and the rests were graded according to their relative values. h, i In vivo efficacy of DXI on tumor growth. Mice (n = 3) xenografted with H460 cells were intraperitoneally injected with DXI (1 or 5 mg/kg) five times in 12 d (h). Mice (n = 6) xenografted with HCC1588 or A549 cells were intravenously injected with DXI (5 mg/kg) five times during the experiment (i). All error bars represent the standard deviation (S.D.). P value is from the two-sided t test. Source data are provided as a Source data file.

