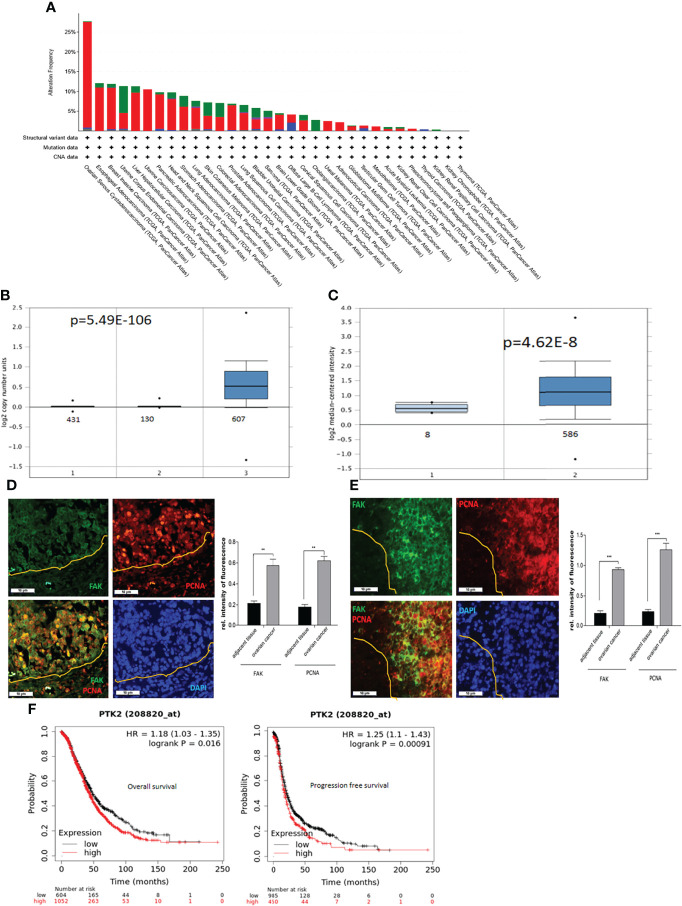
Figure 1.
PTK2 is highly expressed in OC and correlated with OC patient poor survival. (A) PTK2 alteration frequencies in OC compared to other cancer types in TCGA. (B) PTK2 copy numbers were shown in 607 OC compared to 431 normal blood and 130 ovaries in Oncomine. (C) PTK2 expression is significantly upregulated in 586 OC compared to that in 8 normal ovaries in Oncomine. (D, E) Immunofluorescent staining of FAK (green) and PCNA (red) in HGSC (D) or PDX (E) sections. Nuclei were counterstained with DAPI (blue). Fluorescent intensity was quantified by Image J. (F) Survival analysis of OC patients from Kaplan-Meier database. Both overall and PFS survival rates were analyzed from 1656 OC patents (*p<0.05; **p<0.01; ***p<0.001).

