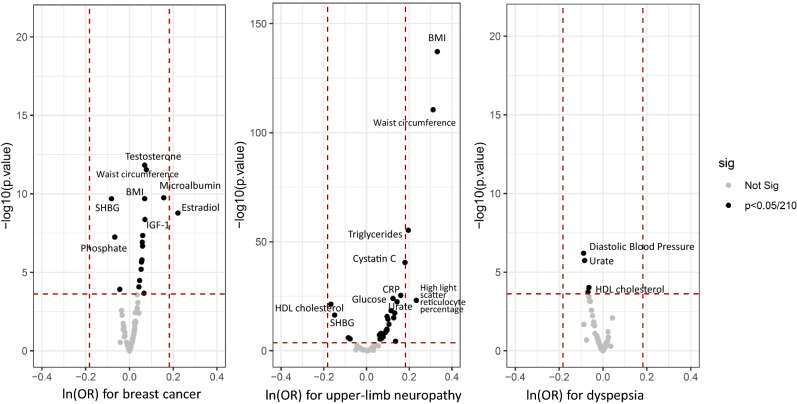
Fig. 3.
The association between biomarkers and selected diseases in the UK Biobank. This figure shows the statistically significant associations between blood and urine biomarkers and the D1s of the 3-line disease trajectories (including upper-limb neuropathy, breast cancer and dyspepsia). All the tested associations are listed in Supplementary Table 3. The horizontal dashed line indicates the p value < 0.05/210 (= 0.00024), while the vertical dashed line indicates an OR > 1.2 or < 0.8

