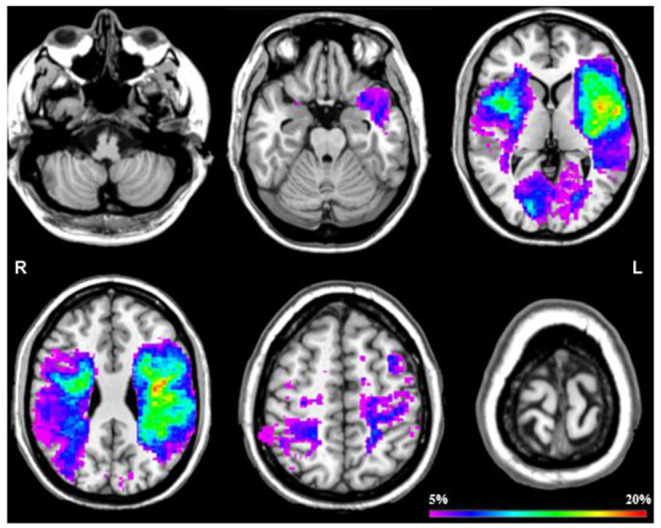
Figure 2.

Probability map of all stroke lesions. This probability map displays a overlap across all stroke patients by 6 slices at z = 25, z = 50, z = 75, z = 100, z = 125 en z = 150. The color scale saturates at 20% which means that in 20% of the patients that specific area was damaged.
