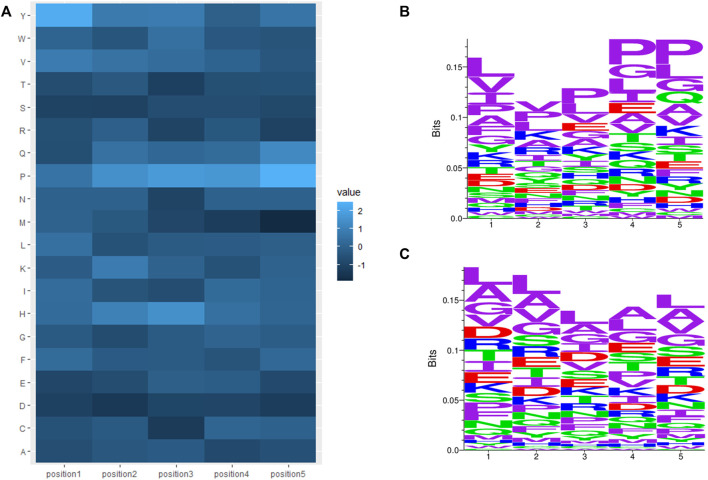
FIGURE 3.
N-terminal features of AHTP positive data and non-AHTP negative data: (A) Heatmap of log odds ratios, where a lighter color denotes overrepresented amino acid residues in AHTPs compared to non-AHTPs (positive log odds score) and, a darker color denotes underrepresented amino acid residues in AHTPs compared to non-AHTPs (negative log odds score). (B) Sequence logos of positions one to five of the AHTP positive dataset. (C) Sequence logos of positions one to five of the non-AHTP negative dataset.

