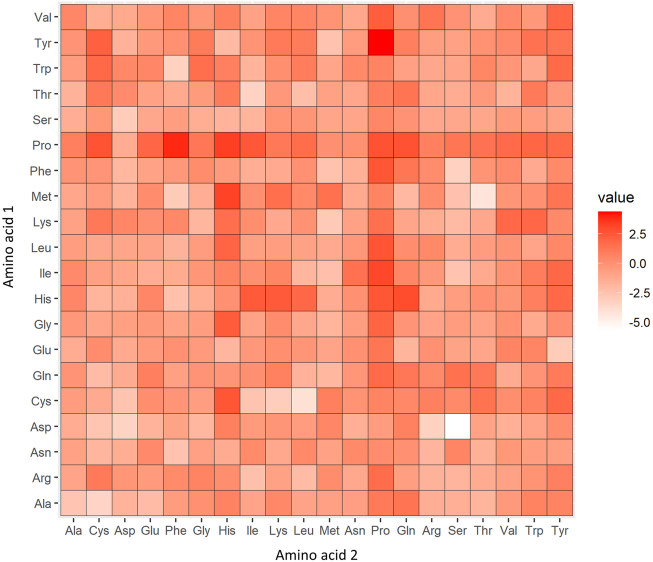
FIGURE 5.
Heatmap of the log odds scores of 2-mers abundant in the positive versus negative datasets. In the heatmap, a red color (high log odds score) denotes 2-mers overrepresented in AHTPs compared to non-AHTPs, and a white color (low log odds score) denotes 2-mers underrepresented in AHTPs compared to non-AHTPs.

