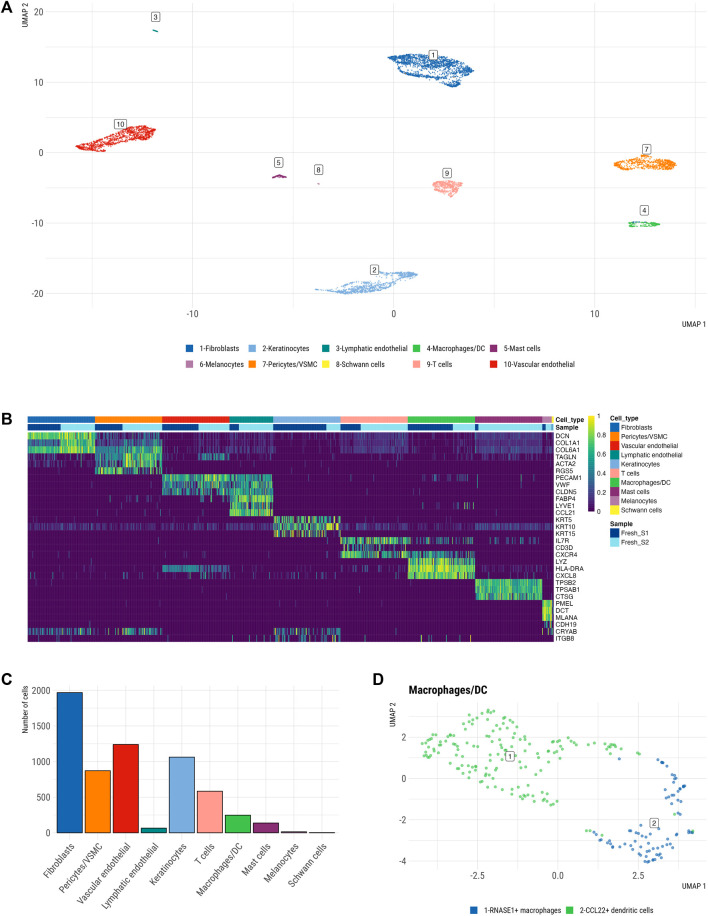
FIGURE 2.
Single cell atlas of freshly dissociated human skin. (A) Uniform manifold approximation and projection (UMAP) plot depicting single-cell transcriptomes from whole human skin (n = 2), coloured by cell type. Each dot represents a single cell (n = 6,192). Color-code defined by manual cluster annotation after unsupervised clustering was performed via Walktrap clustering (see Methods). Shown are 10 principal skin cell populations including fibroblasts, keratinocytes, lymphatic endothelial cells, macrophages/DC, mast cells, melanocytes, pericytes/VSMCs, Schwann cells, T cells, vascular endothelial. (B) Heatmap showing the three marker genes of each cell cluster. Each column represents a single cell, each row represents an individual gene. A maximum of a hundred cells were sampled per cell cluster. Magnitude of gene expression measured in scaled log normalized UMI counts. Yellow indicates maximum gene expression and purple indicates no expression of the gene. (C) Relative abundance of main cell types across integrated fresh skin samples. (D) Macrophage/DC cluster containing a larger population of 165 DCs and a smaller population of 82 macrophages.

